Paper Pigeon

Please feel free to contribute to the github for this project! Right now, I’m working on create a drag-and-drop system, web scraper, and architecture for a n8n system, allowing a user to create a network for any research system. I also aim to do statistical analyses on given data
Overview
Paper Pigeon is a research exploration tool built around a force-directed graph of researchers, labs, and papers from the University of Washington Allen School.
Instead of treating research discovery as a list or search problem, the system models relationships explicitly and lets structure emerge visually.
The graph can be explored directly, filtered by topic or lab, and queried through a lightweight AI layer. There is also an optional resume-matching path that compares a user’s background against the existing research graph.
A live demo is available here: https://paper-pigeon-deployment.vercel.app/
Core Components
3D Research Graph
At the center of the system is a force-directed graph rendered with 3d-force-graph and Three.js. Nodes represent researchers, papers, and labs; edges encode authorship, affiliation, and topical similarity.
To keep initial load times predictable, the graph is generated offline and served as static JSON rather than assembled dynamically from a database.
Resume-Based Similarity Matching
Users can upload a resume, which is embedded and compared against paper abstracts and researcher topic vectors. This step is optional and runs independently of the main graph, so it does not affect baseline performance or usability.
Paper-Level Q&A
Individual papers can be queried through a retrieval-augmented generation pipeline. Responses are grounded in the paper text and return citations rather than free-form summaries, which keeps the interaction closer to “assisted reading” than chat.
VR Rendering Path
The same graph data can be rendered in a VR context using A-Frame. This is not a separate system; it reuses the existing layout and node metadata, with the primary difference being input and camera control.
Researcher Profiles and Search
Each researcher node links to a profile view containing publications, lab affiliations, and topic tags. Search operates over this metadata rather than over raw graph structure.
Architecture
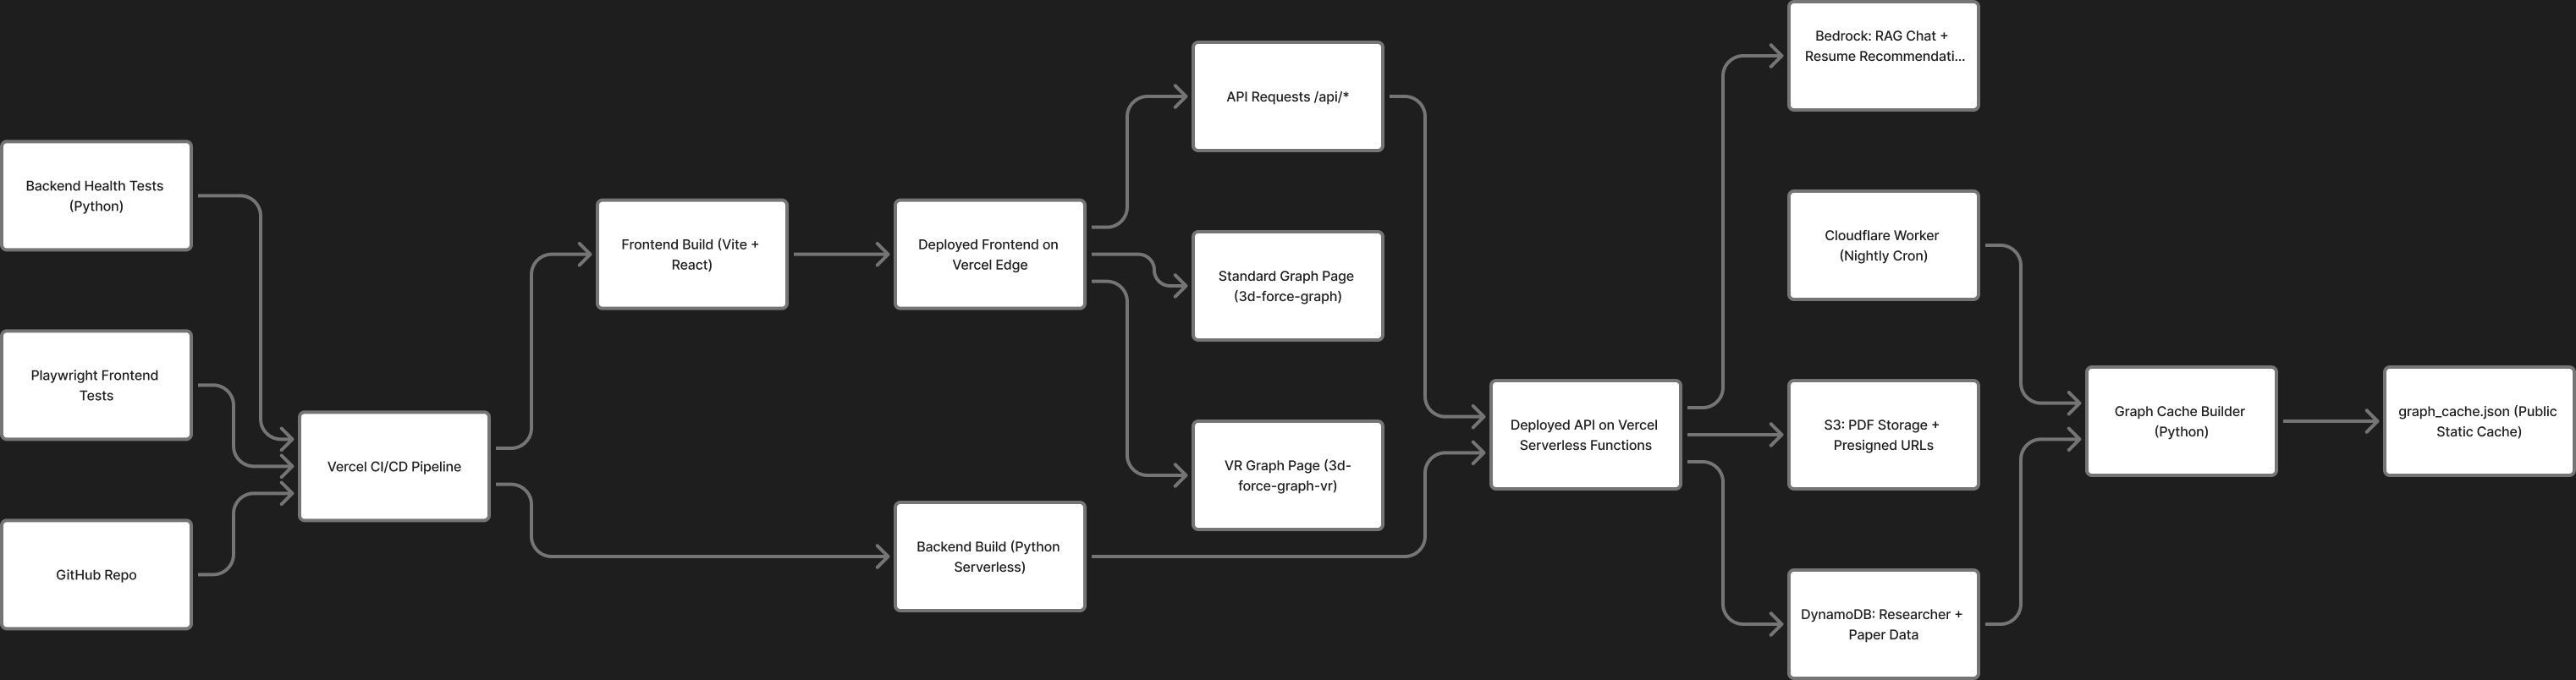
The system is structured to minimize runtime complexity and operational cost:
- Frontend: Vite + React 19 + TypeScript
- Rendering: WebGL via Three.js and 3d-force-graph
- Backend: Flask API deployed as Vercel Serverless Functions
- AI Layer: AWS Bedrock for embeddings and retrieval-augmented generation
- Storage: DynamoDB for relationship data, S3 for PDFs (served via presigned URLs)
- Caching: Cloudflare Workers rebuild the optimized graph JSON on a schedule
- CI/CD: Automated deployment with Playwright-based integration tests
Most user interactions are handled entirely on the client, with serverless calls reserved for AI inference and document retrieval.
What This Is For
Paper Pigeon exists to answer a simple question:
Who is working on what, and how are those efforts connected?
By making relationships explicit and navigable, the system is meant to support exploration, orientation, and early-stage collaboration.