Quantitative Pairs Trading
Overview
A quantitative research pipeline using pairs trading strategies. Downloads historical stock price data, identifies correlated pairs, generates mean-reversion signals using the Ornstein-Uhlenbeck process, and produces visualizations to validate trading assumptions and evaluate strategy performance.
Technologies & Frameworks
- Python 3.10+ - Core programming language
- Pandas - Data manipulation and time series analysis
- NumPy - Numerical computing and matrix operations
- yfinance - Yahoo Finance API for market data
- Matplotlib - Visualization and plotting
- SciPy - Statistical analysis and signal processing
- scikit-learn - Machine learning utilities and data normalization
- PyArrow - Fast columnar data storage (Parquet format)
How It Works
1. Data Acquisition
The system fetches daily OHLCV data from Yahoo Finance for a configurable universe of stocks across multiple sectors (technology, financials, energy, consumer goods).
2. Price Panel Construction
Raw price data is transformed into an aligned date × symbol matrix with forward-fill for missing values, ensuring no lookahead bias.
3. Pair Selection
Identifies highly correlated stock pairs using rolling correlation analysis. Only pairs with correlation above a threshold (default: 0.7) are selected for trading.
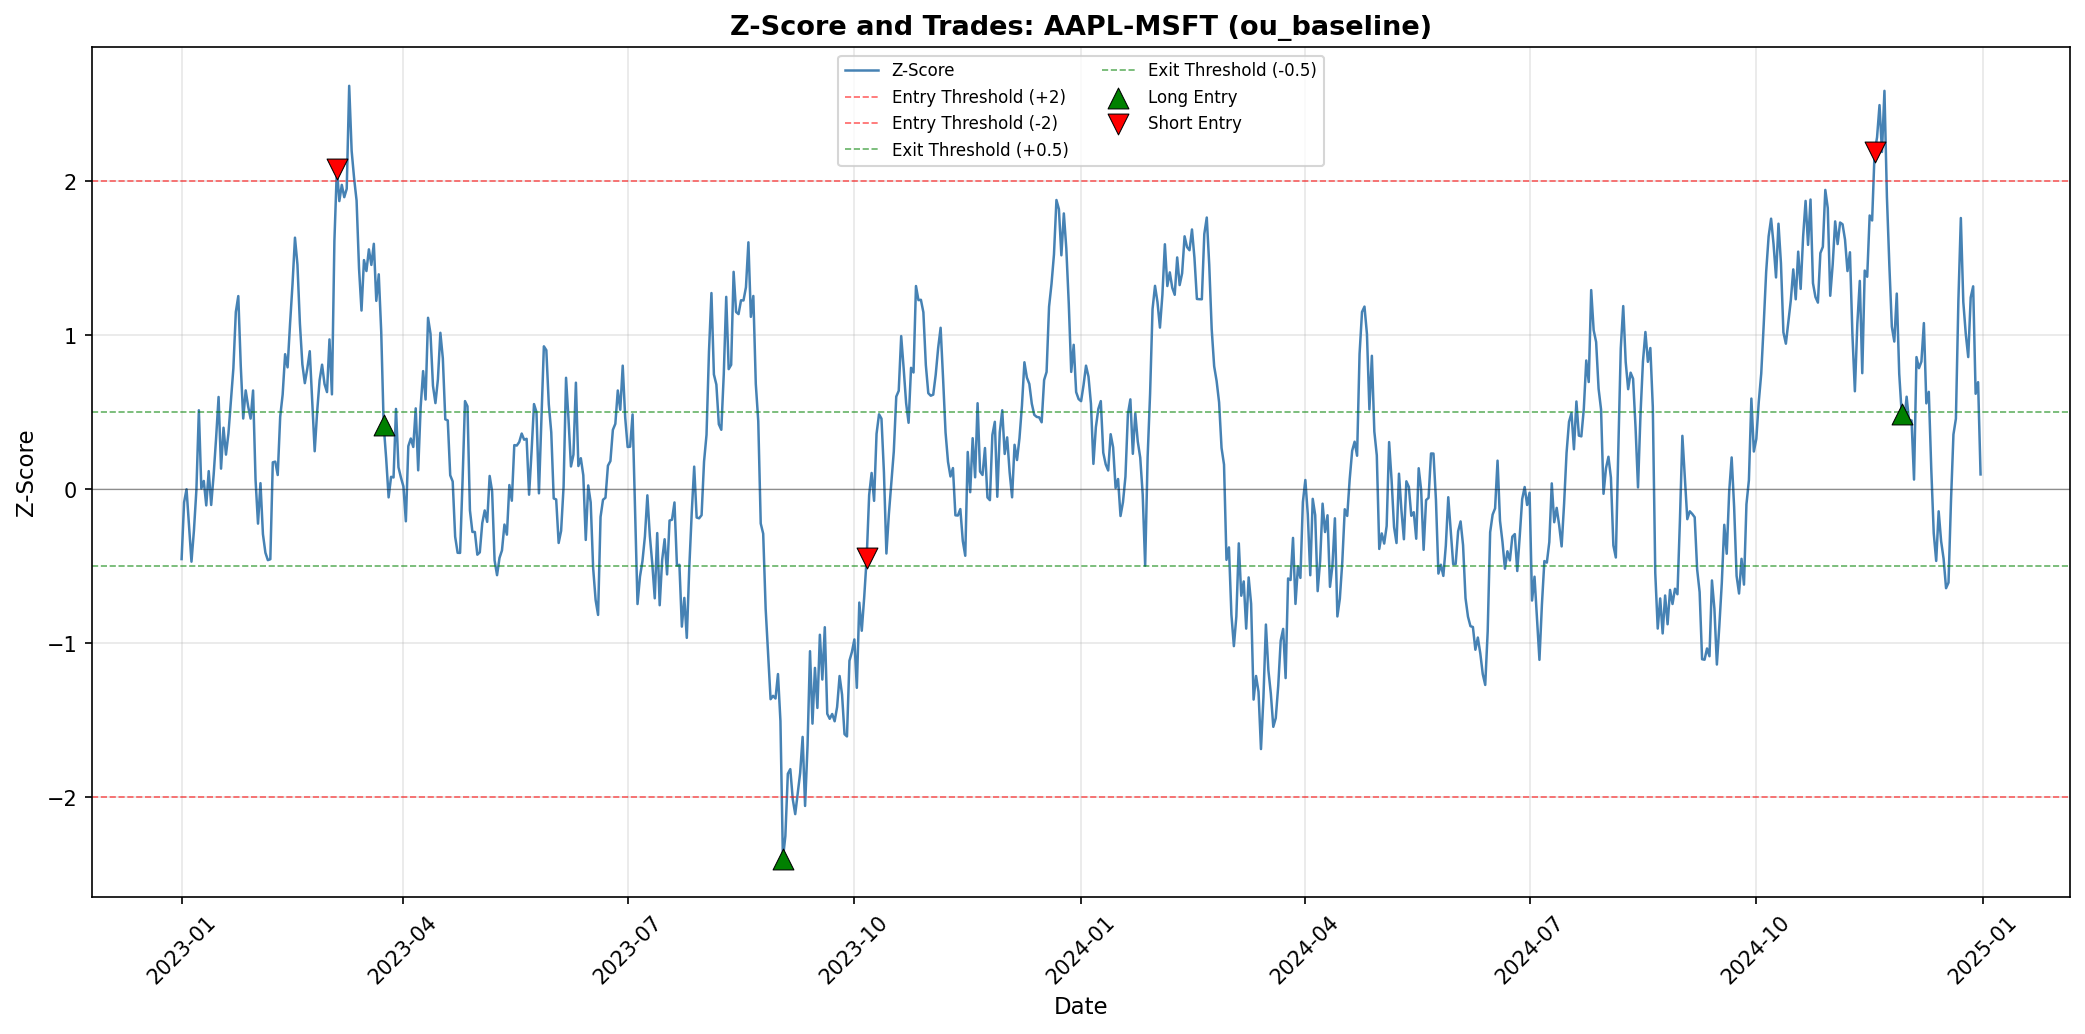
4. Signal Generation
For each pair, the system:
- Computes log-price spreads with dynamic hedge ratios
- Calculates rolling z-scores to measure spread deviation
- Generates mean-reversion trading signals (enter when |z-score| > 2.0, exit when |z-score| < 0.5)
5. Performance Analysis
Simulates trades with realistic transaction costs, tracks portfolio equity, and computes standard performance metrics (CAGR, Sharpe ratio, maximum drawdown).
6. Visualization & Reporting
Produces 25+ research-grade visualizations to validate statistical assumptions and evaluate strategy robustness.
Research Visualizations
Critical Statistical Validation
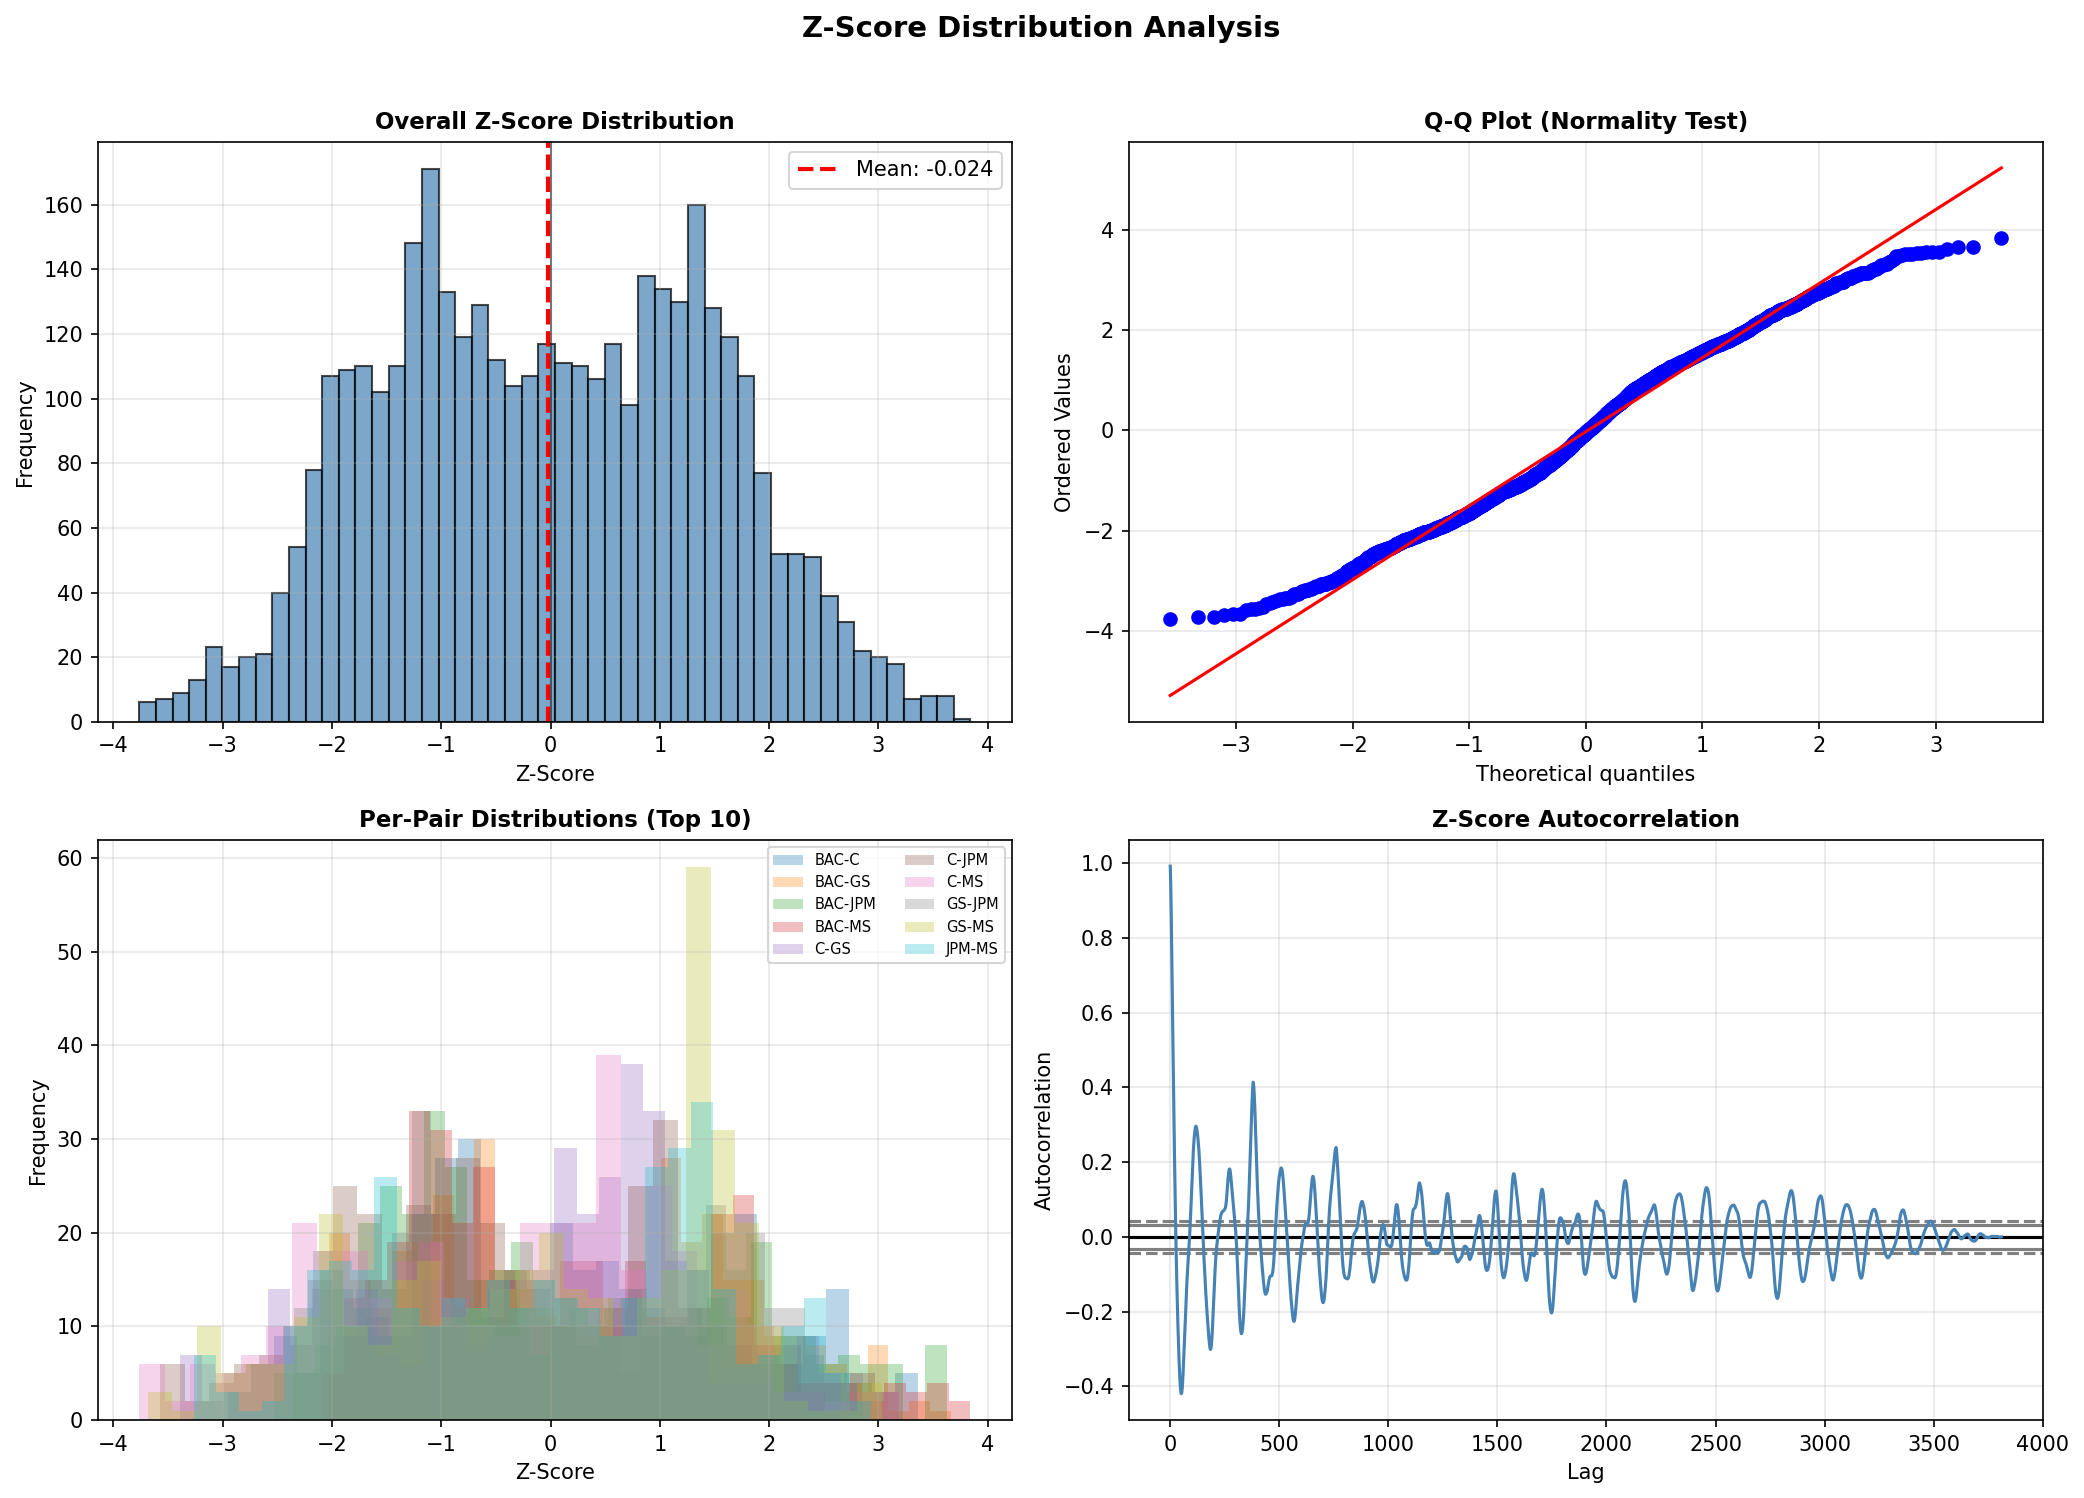
Z-Score Distribution Analysis
Validates the mean-reversion assumption by analyzing z-score distributions, normality (Q-Q plot), autocorrelation decay, and per-pair behavior.
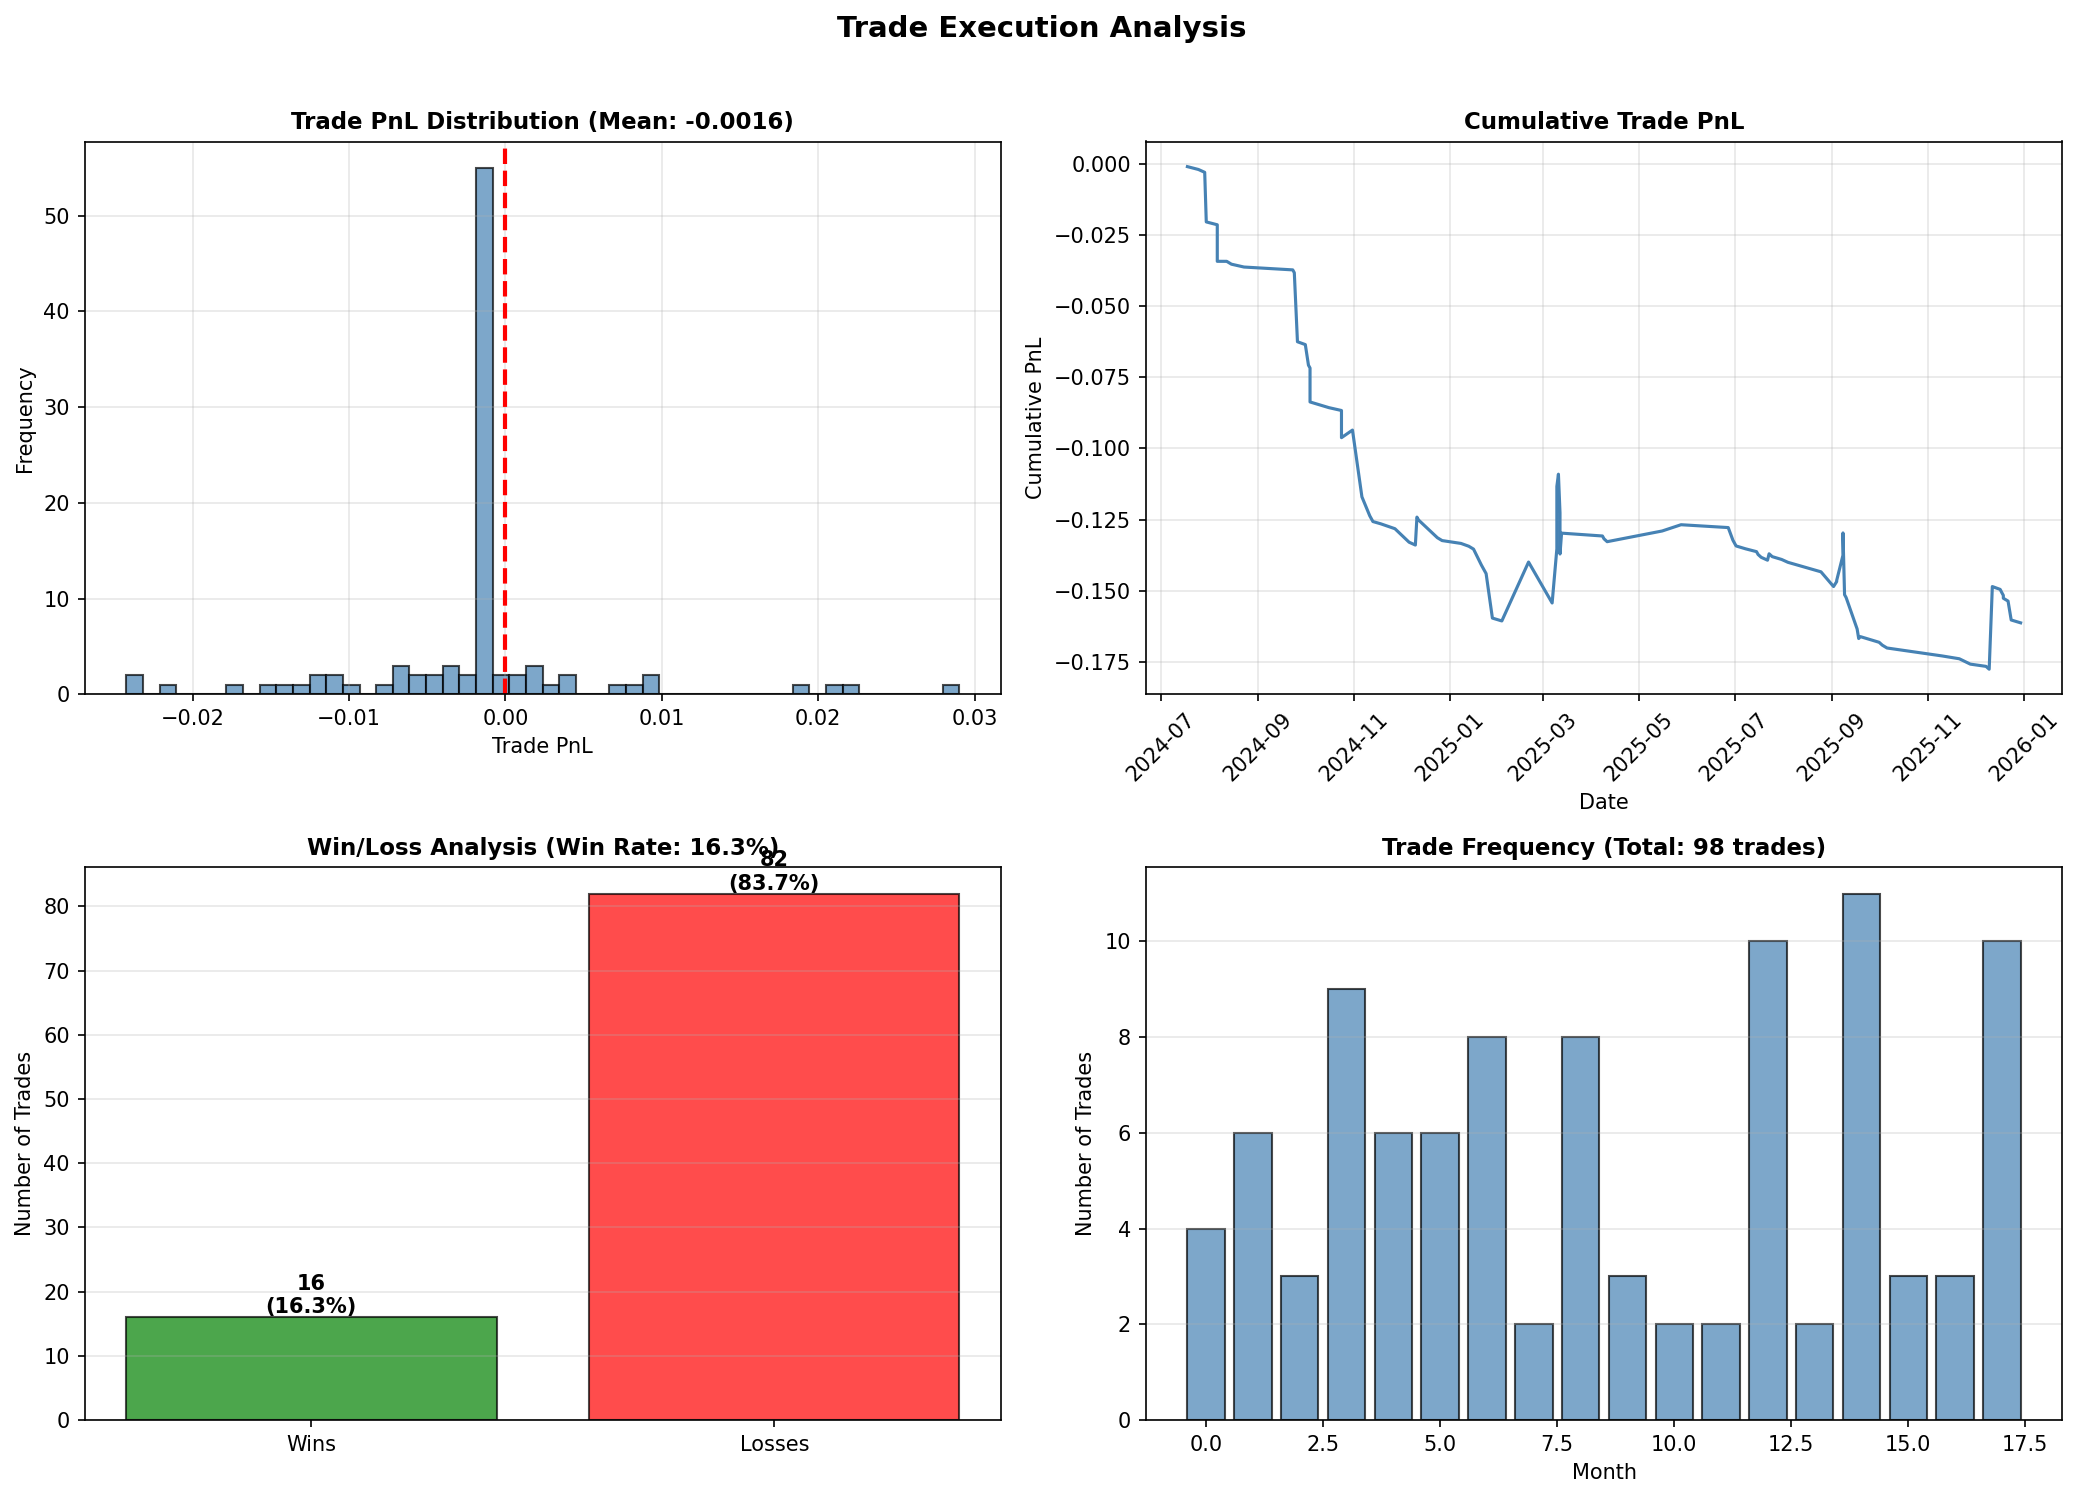
Trade Analysis
Shows trade profitability distribution, cumulative PnL, win/loss ratios, and trade frequency over time.
Performance Overview
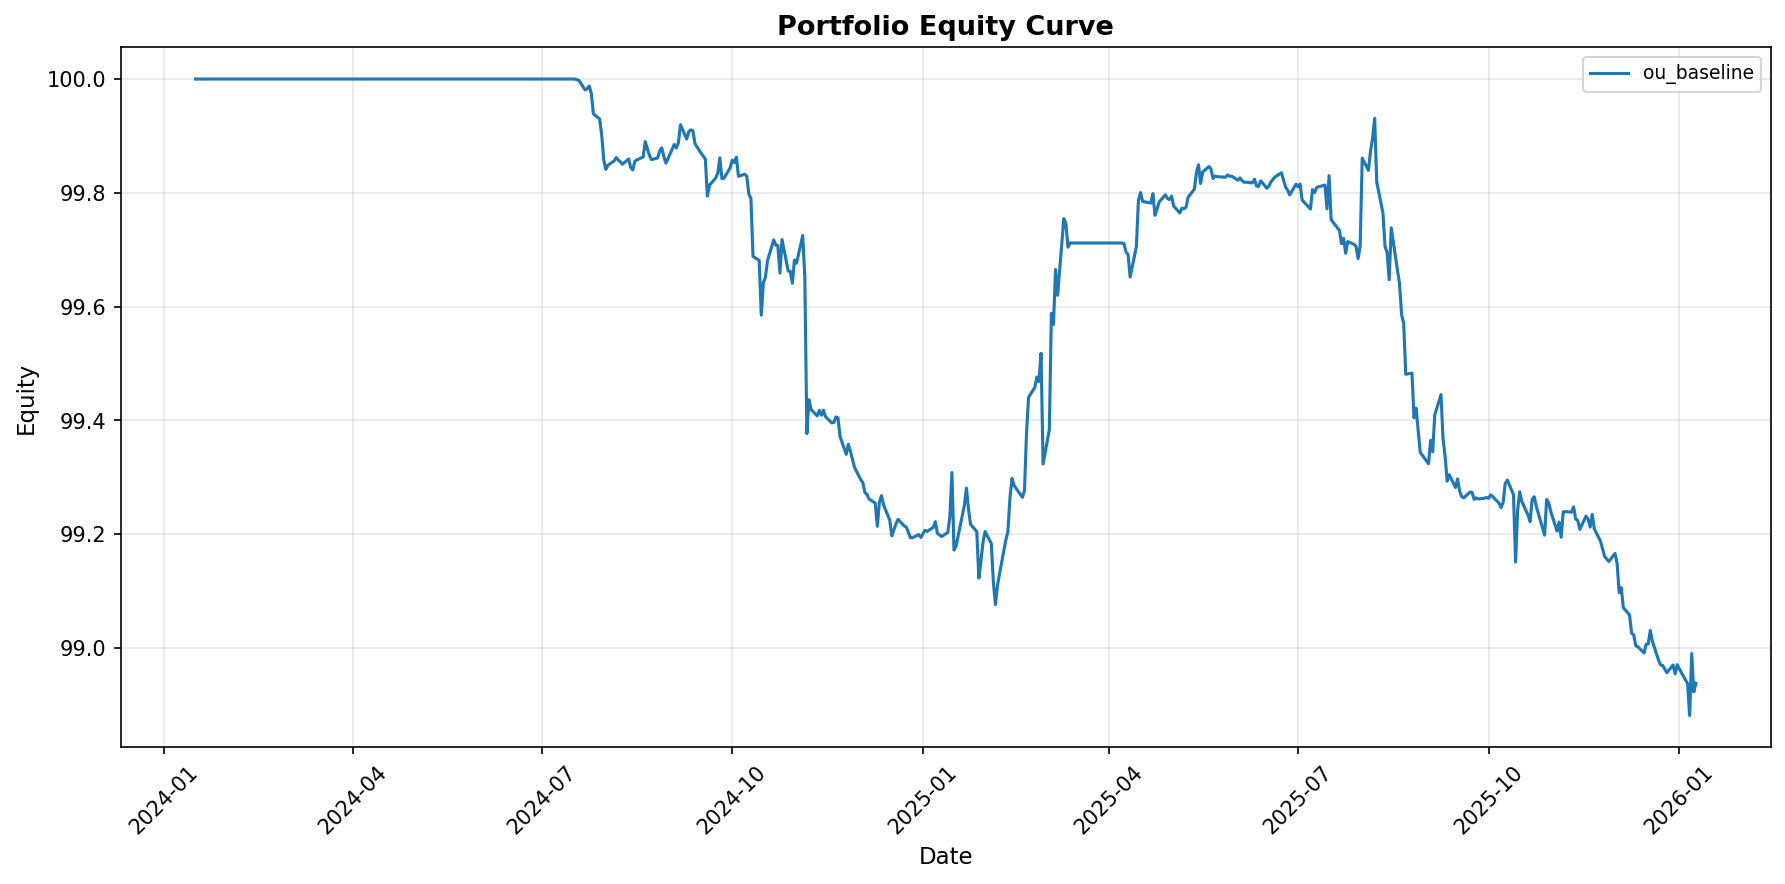
Equity Curve
Portfolio value over time showing overall strategy performance.
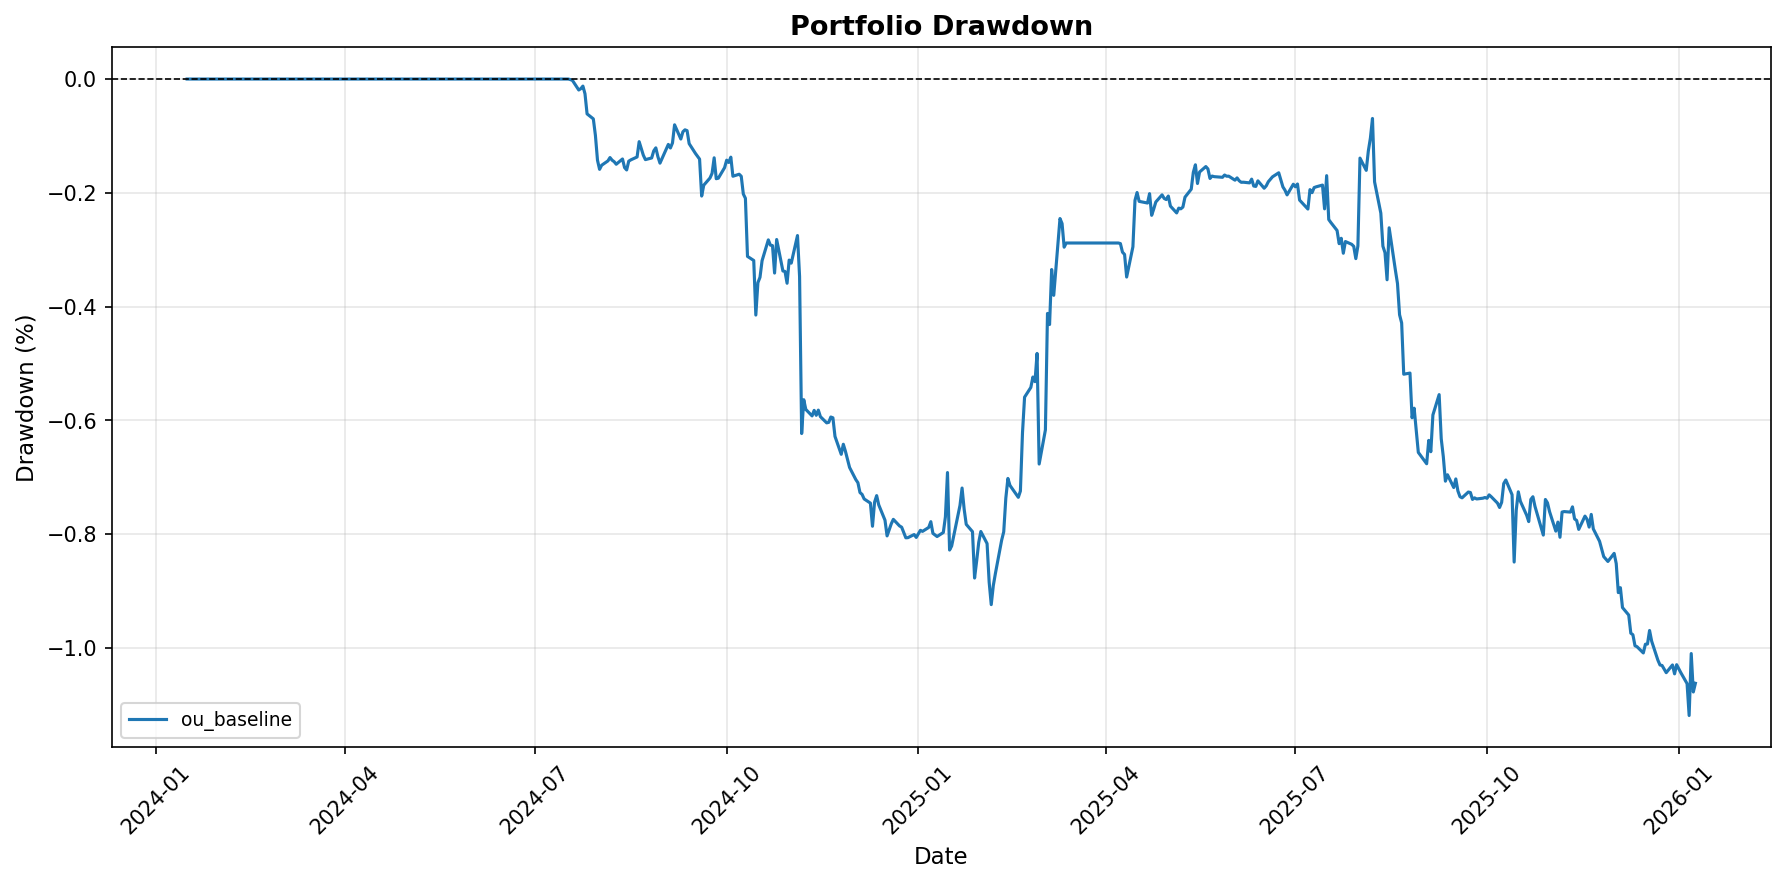
Drawdown Analysis
Visualizes percentage decline from peak equity to assess risk.
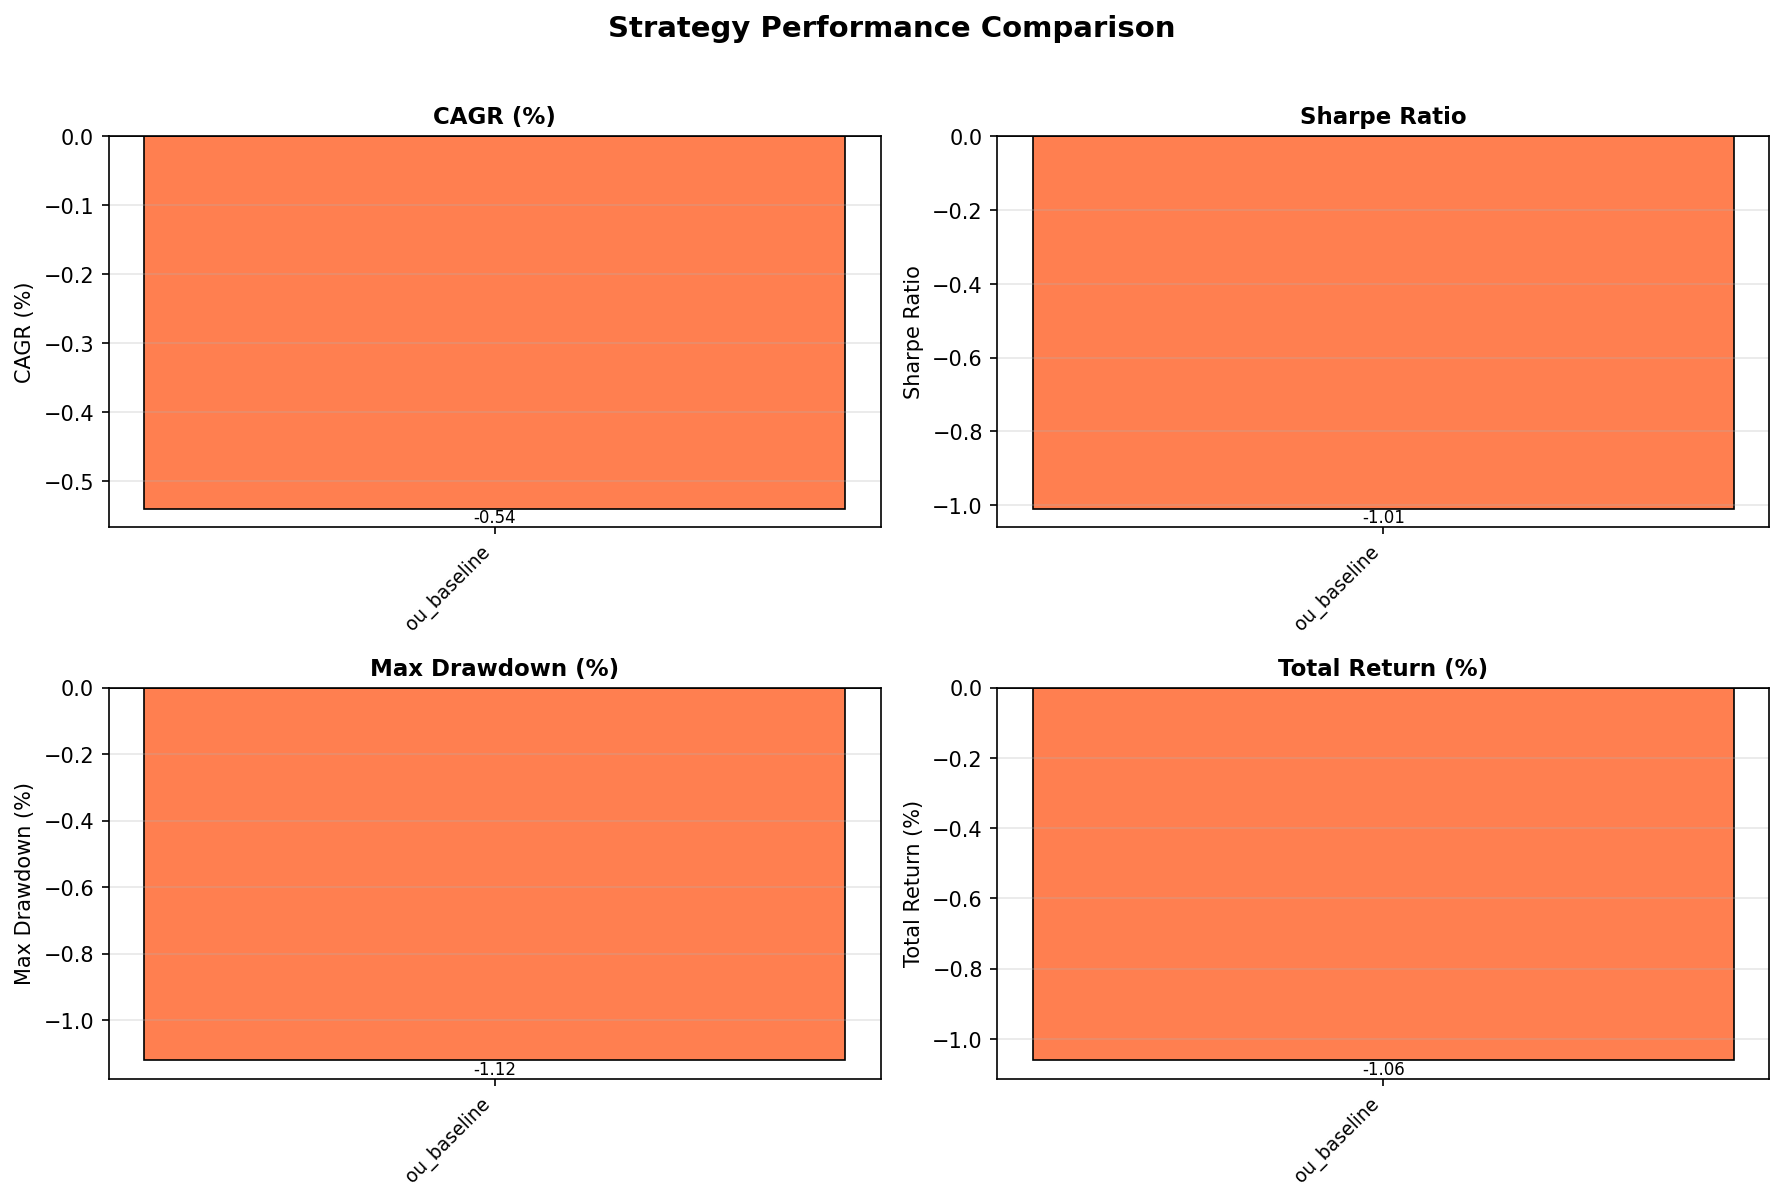
Strategy Comparison
Bar charts comparing key metrics across different strategies.
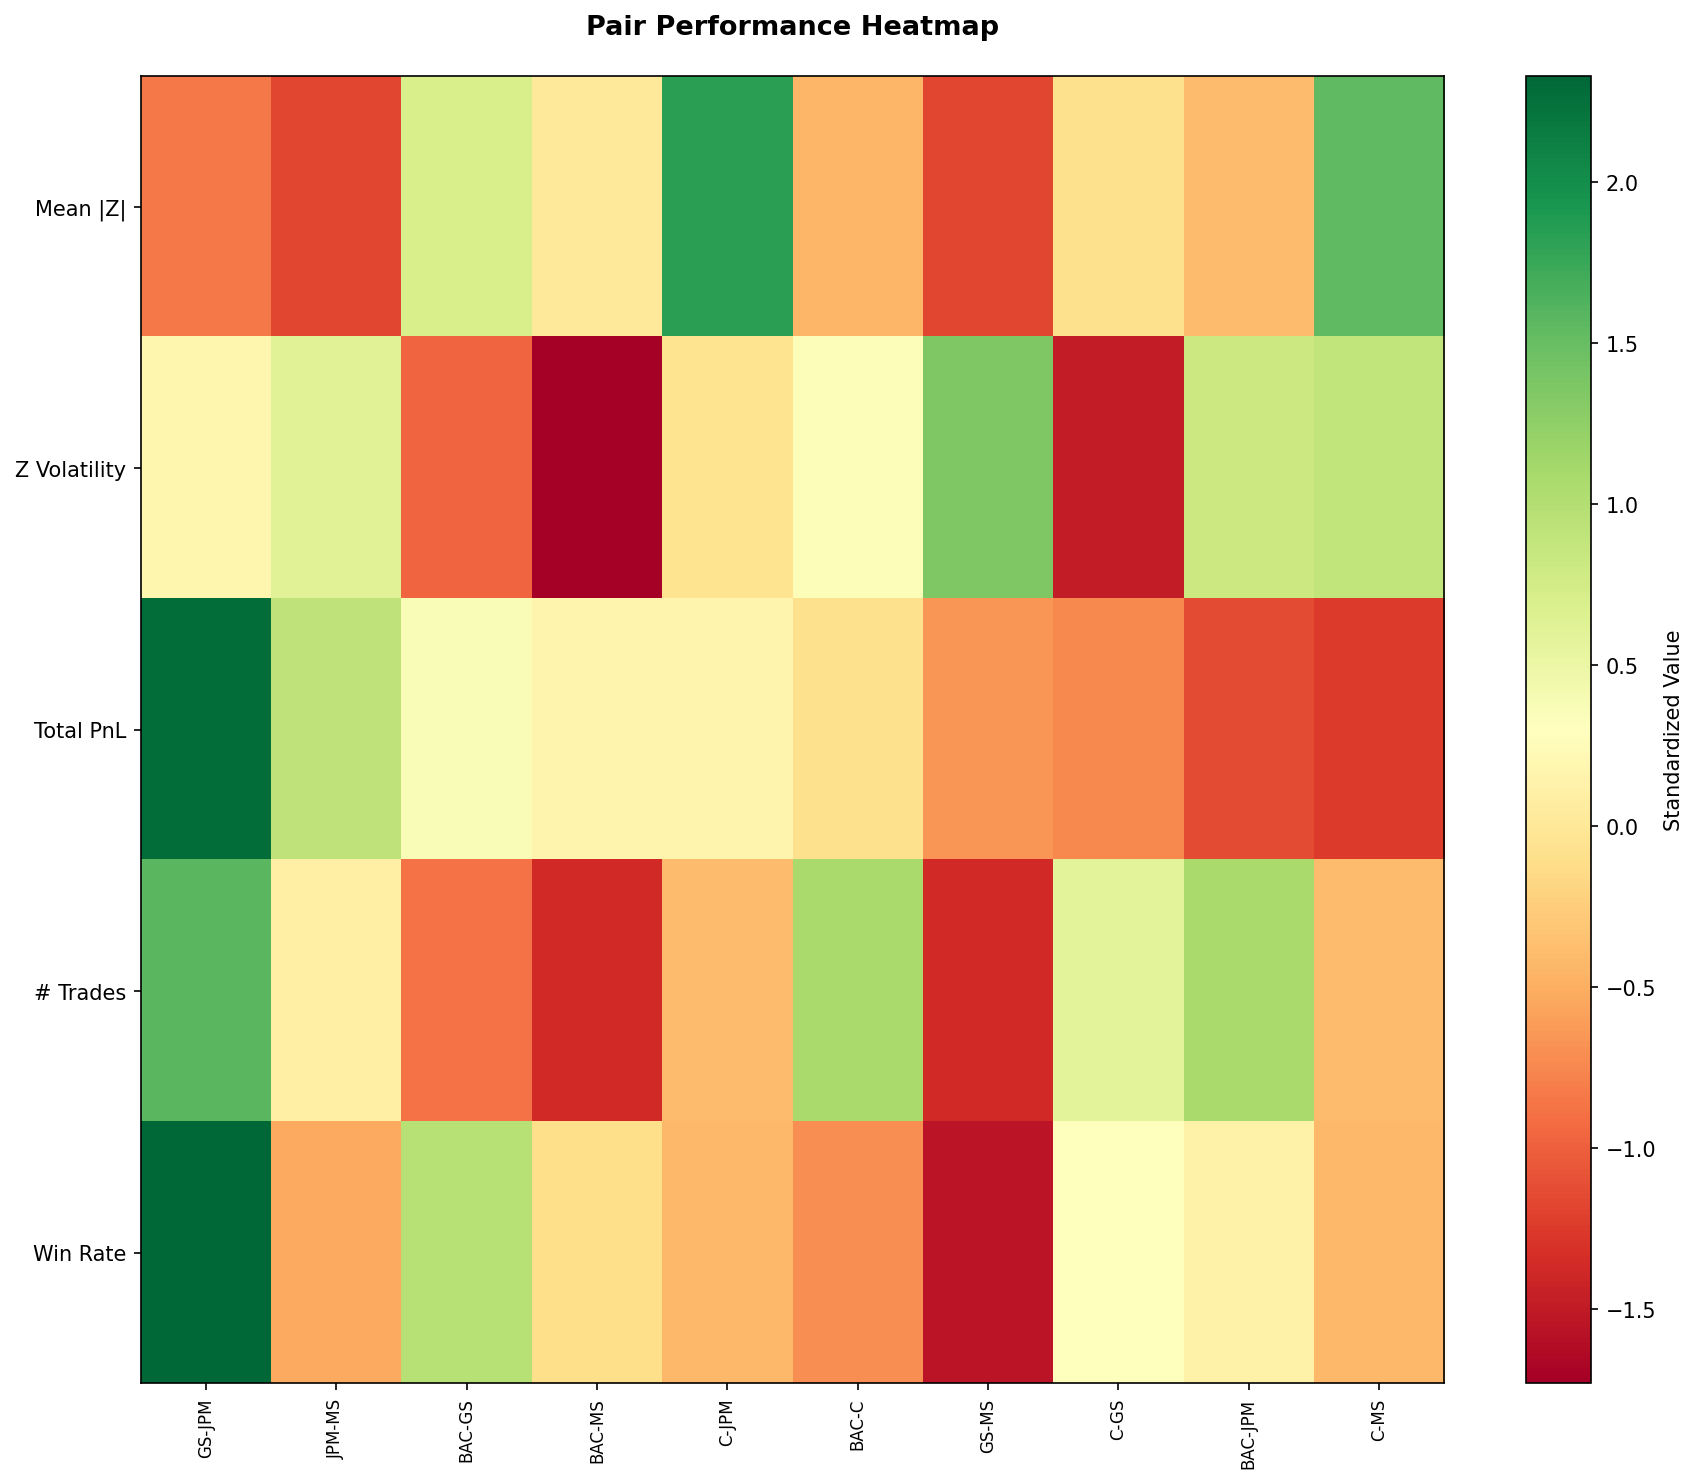
Pair-Level Analysis
Pair Performance Heatmap
Standardized metrics showing best and worst performing pairs.
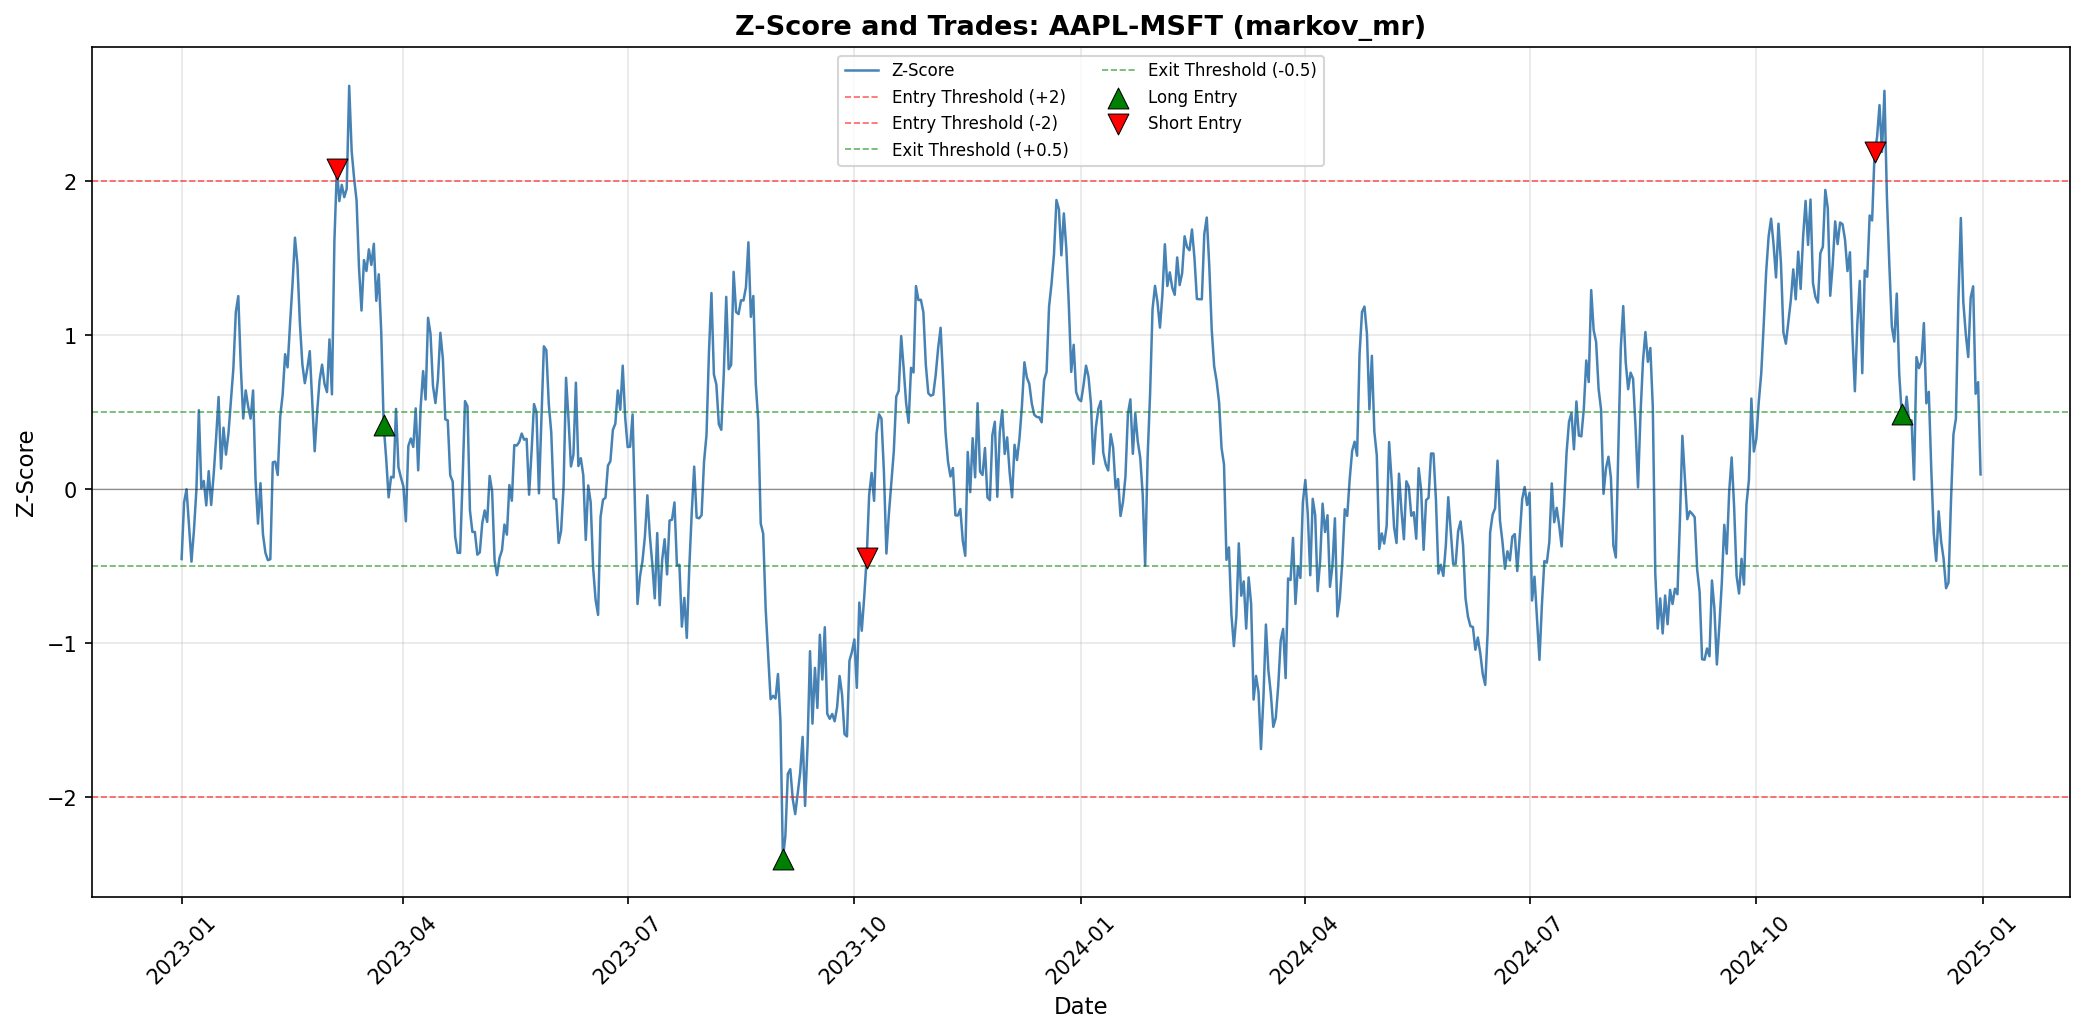
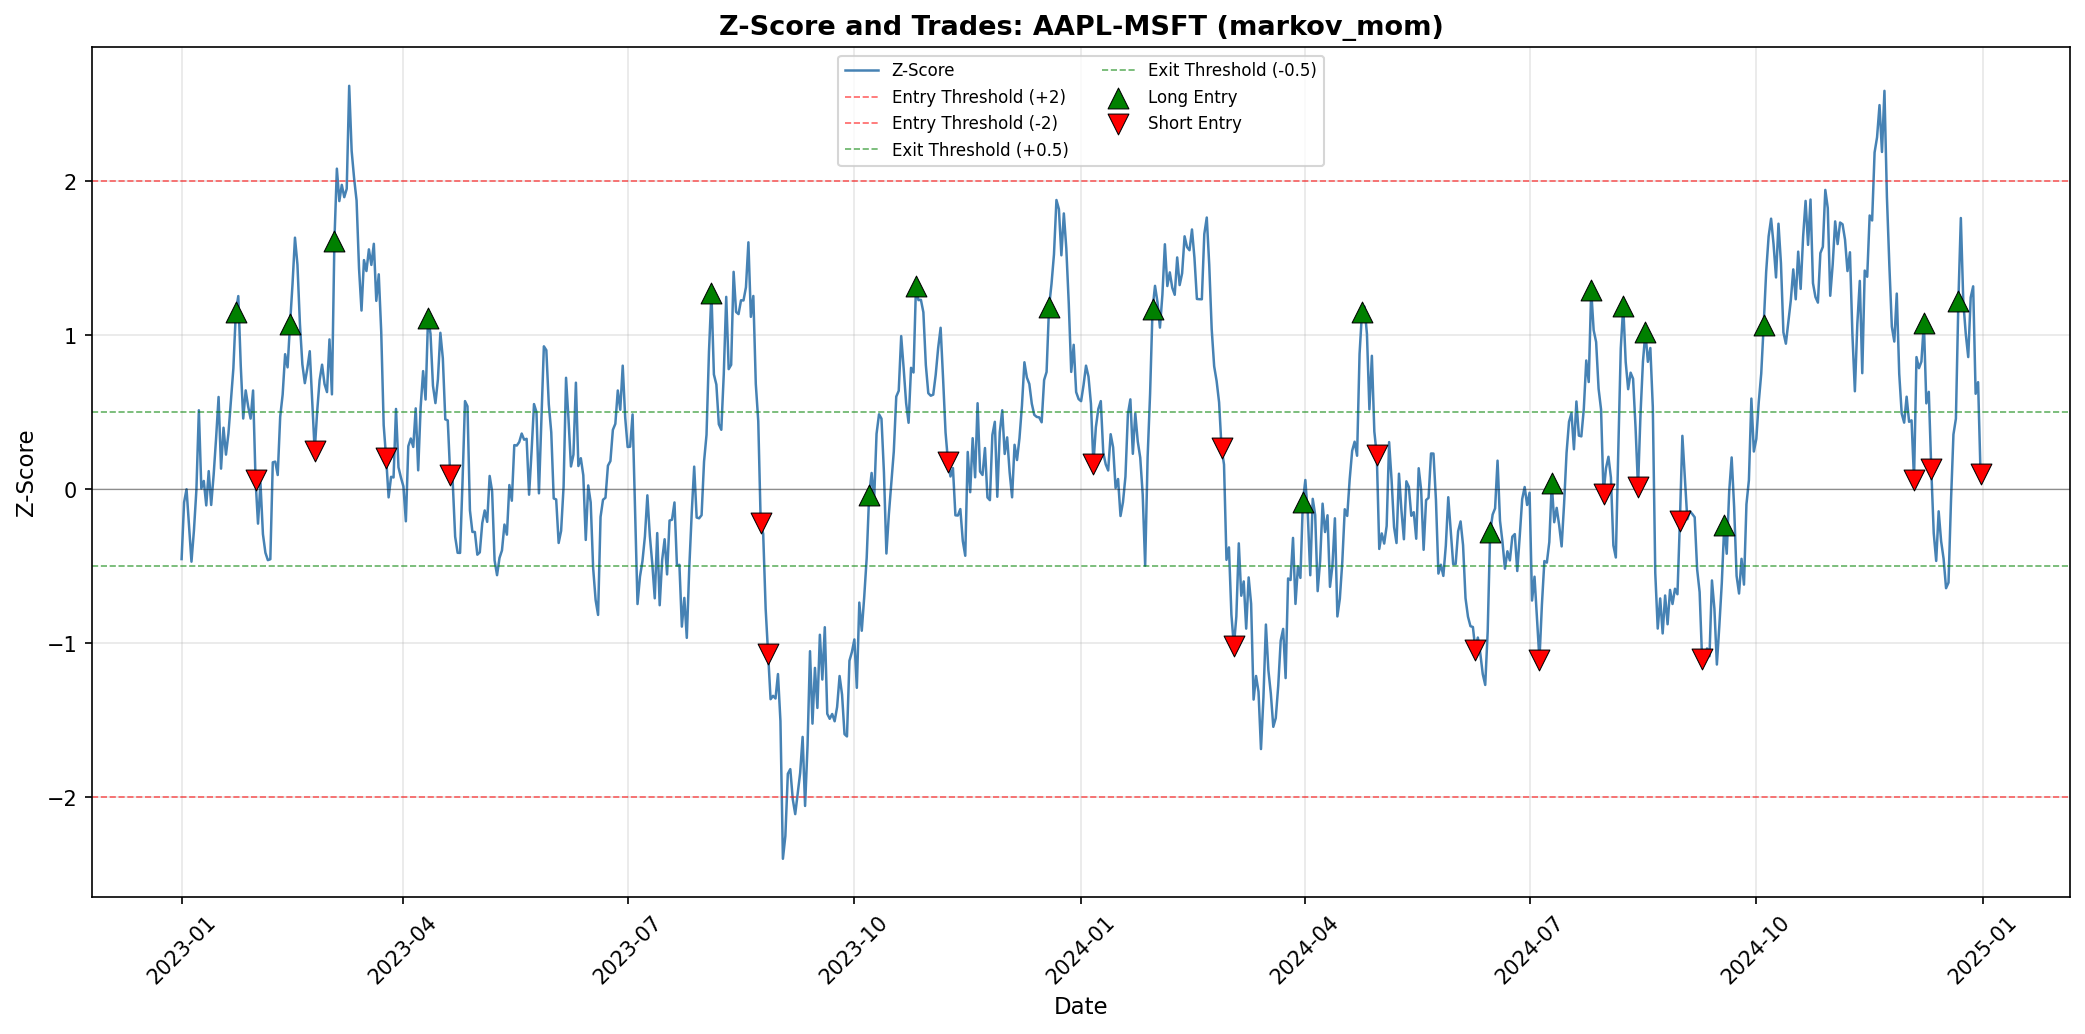
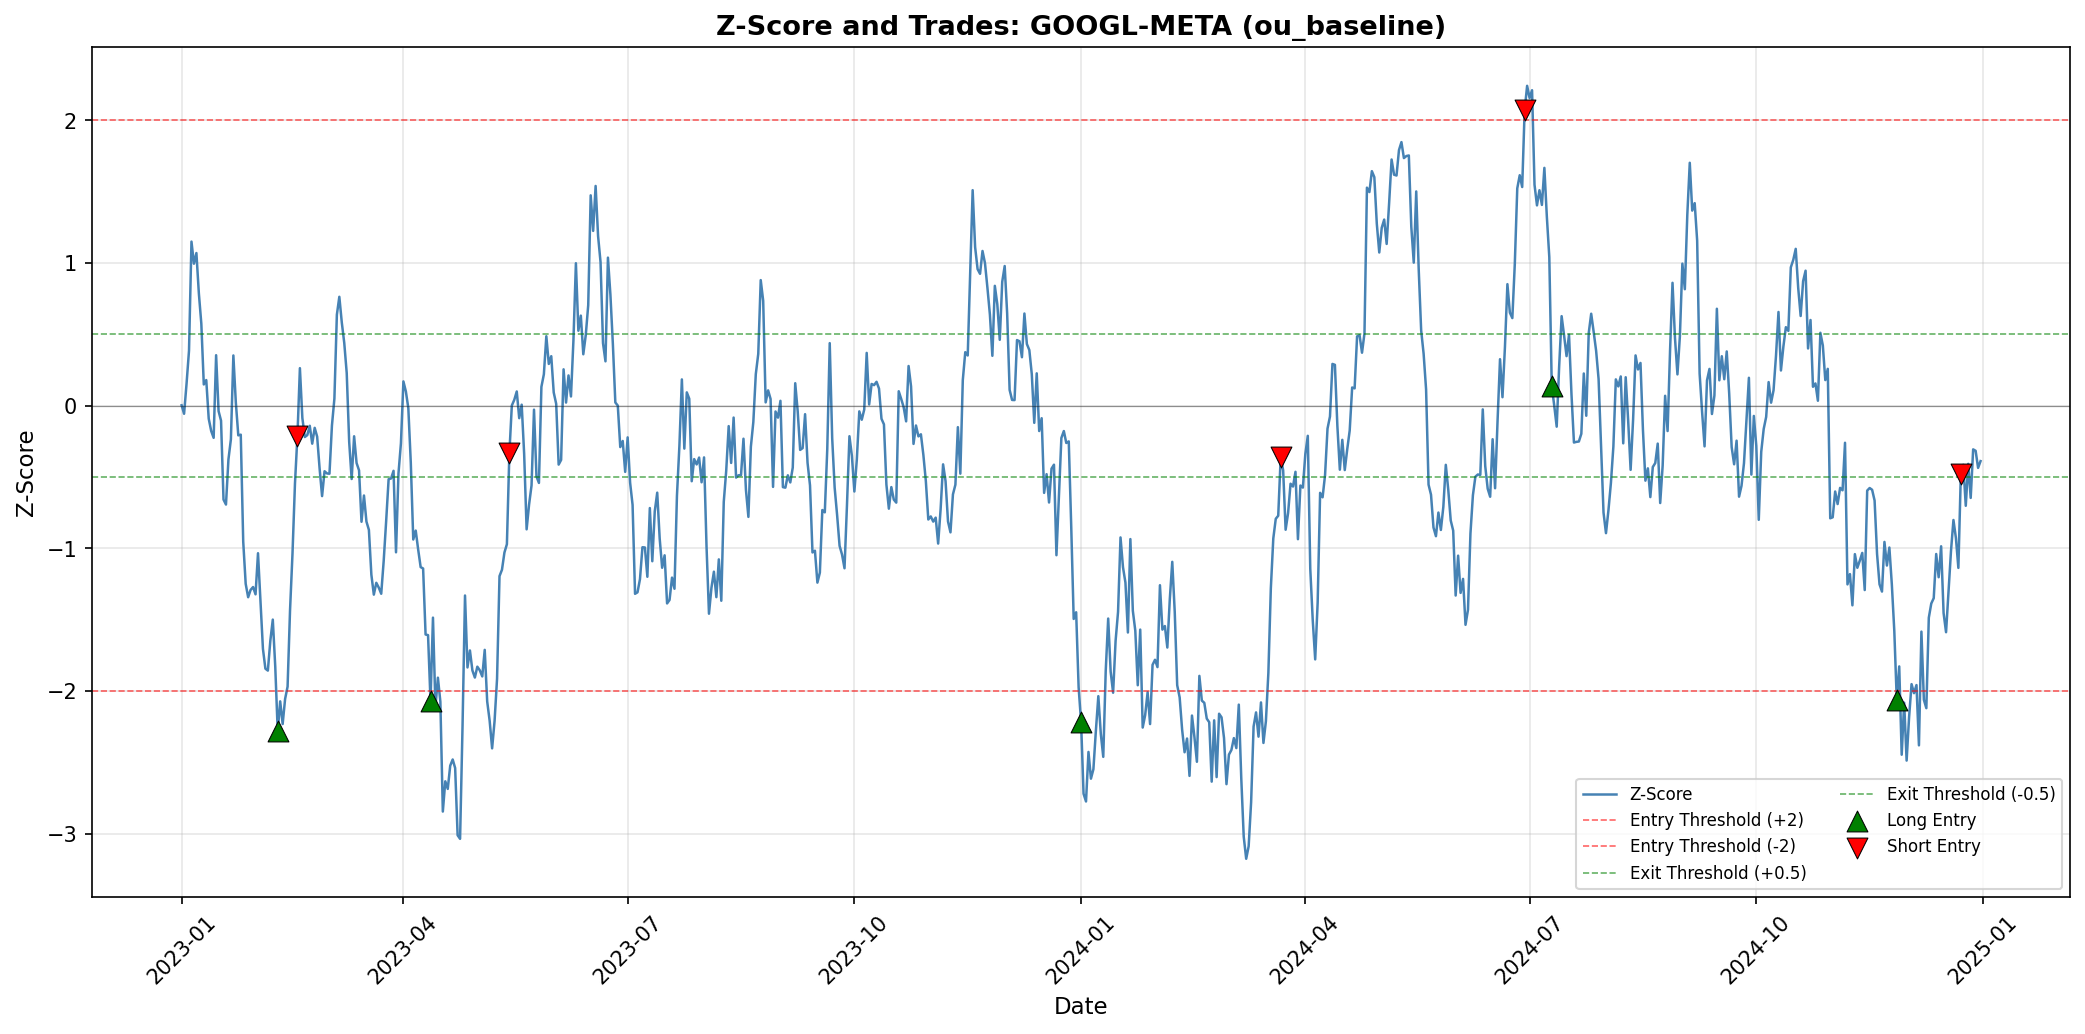
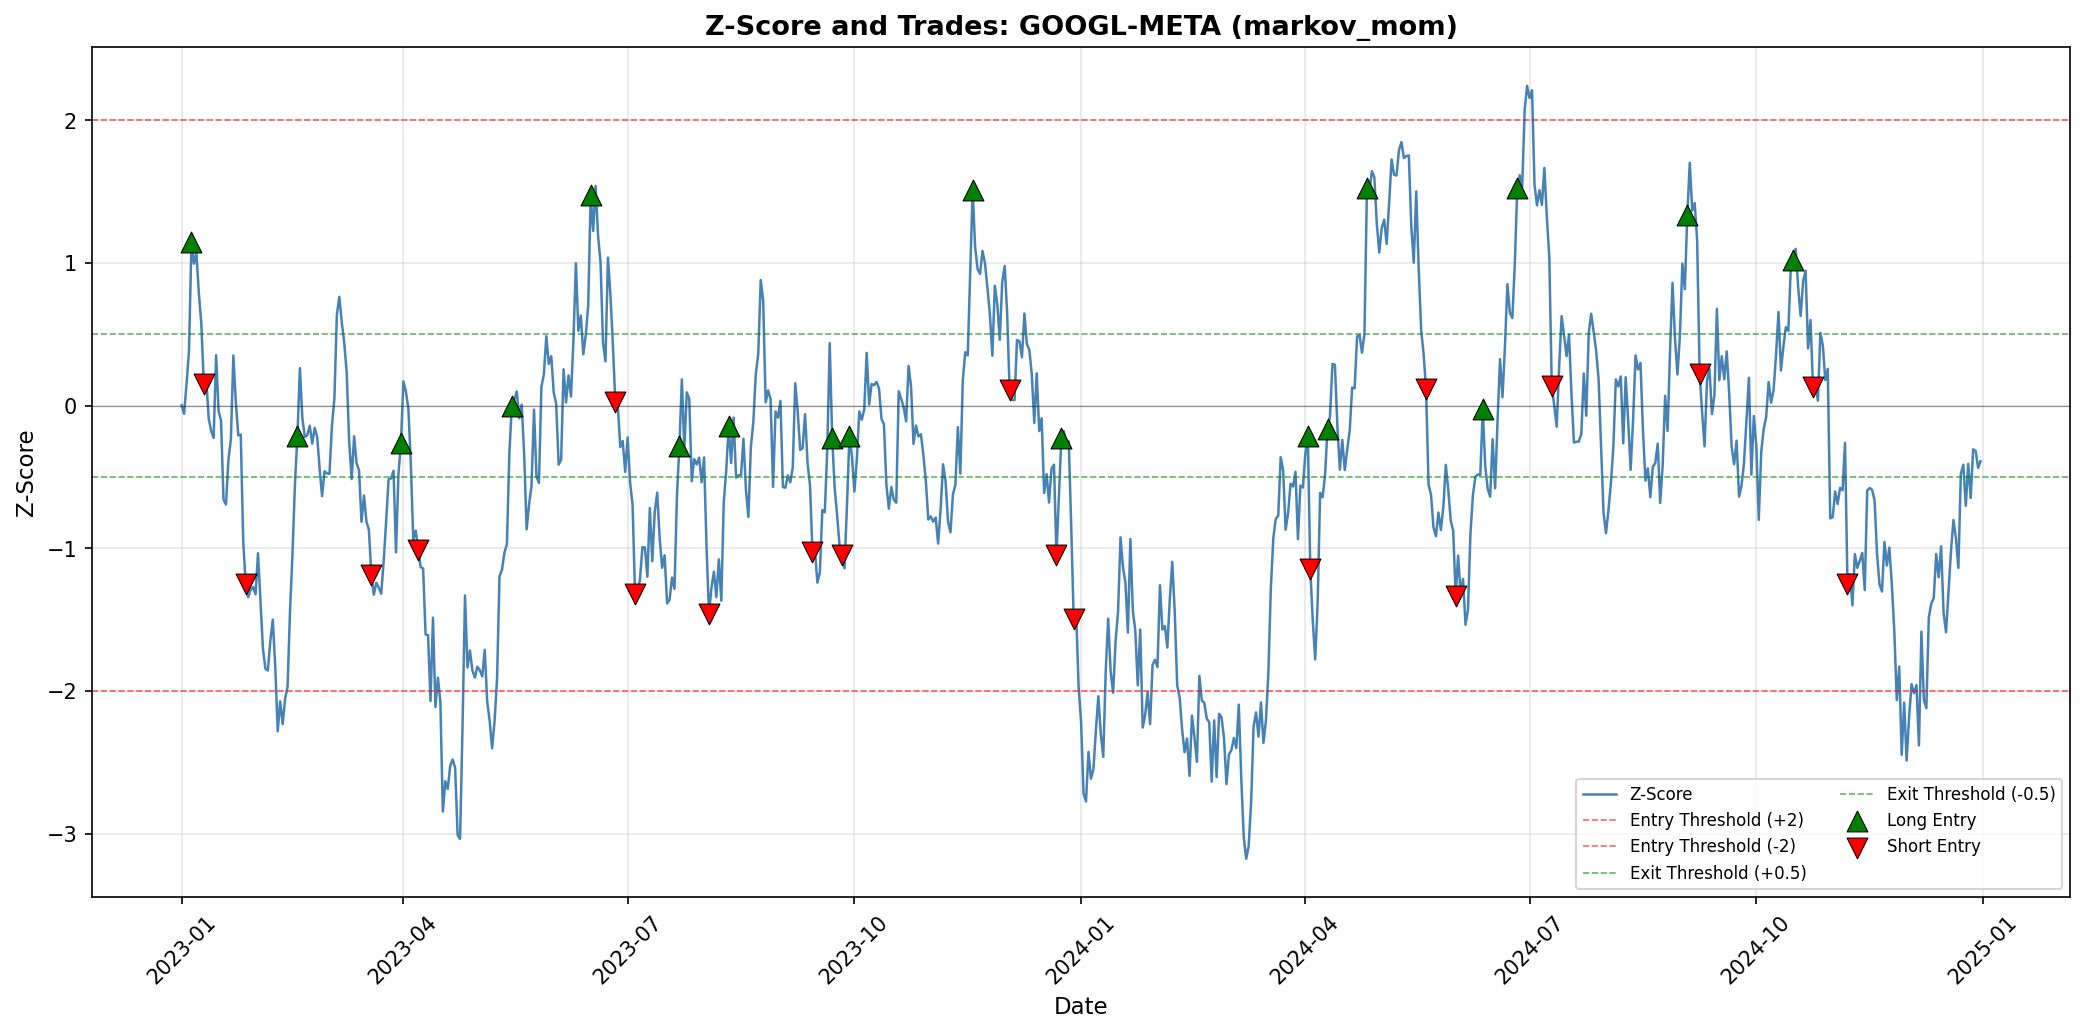
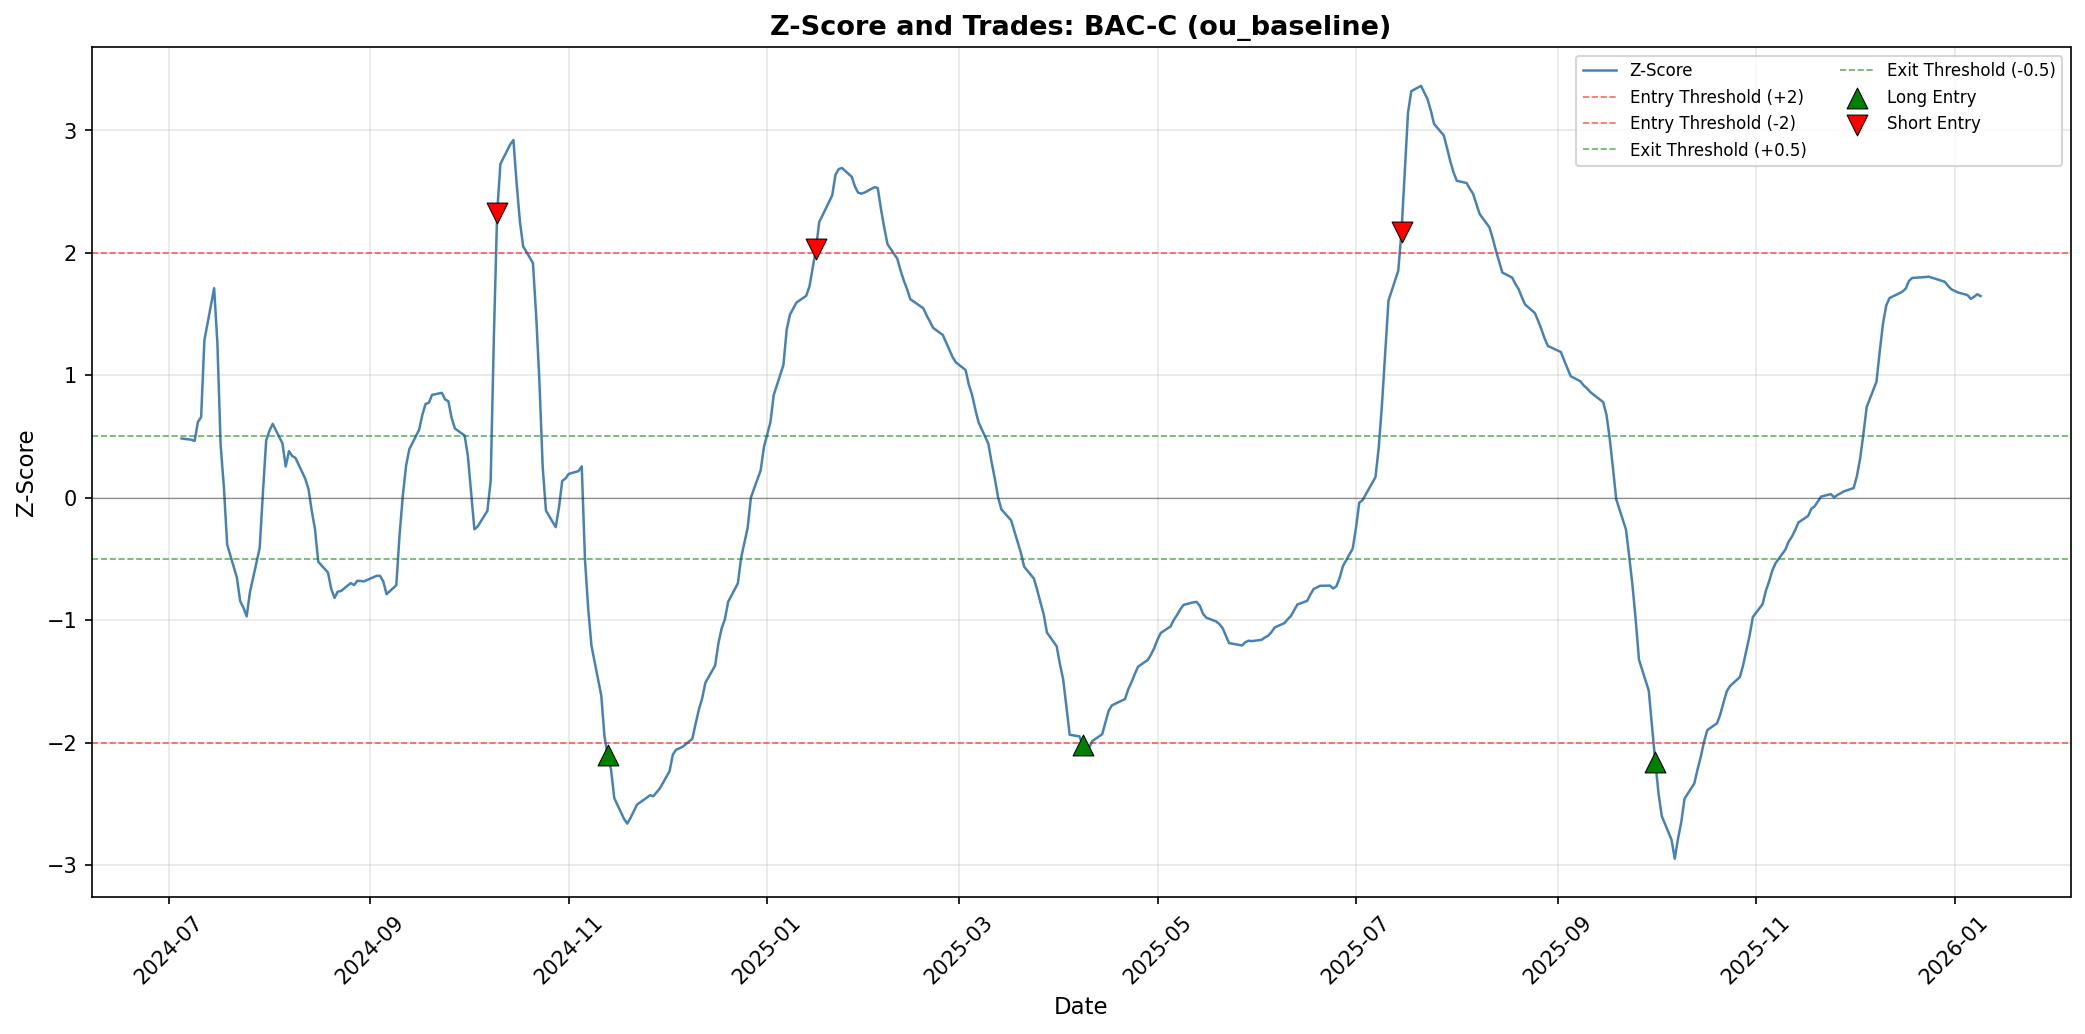
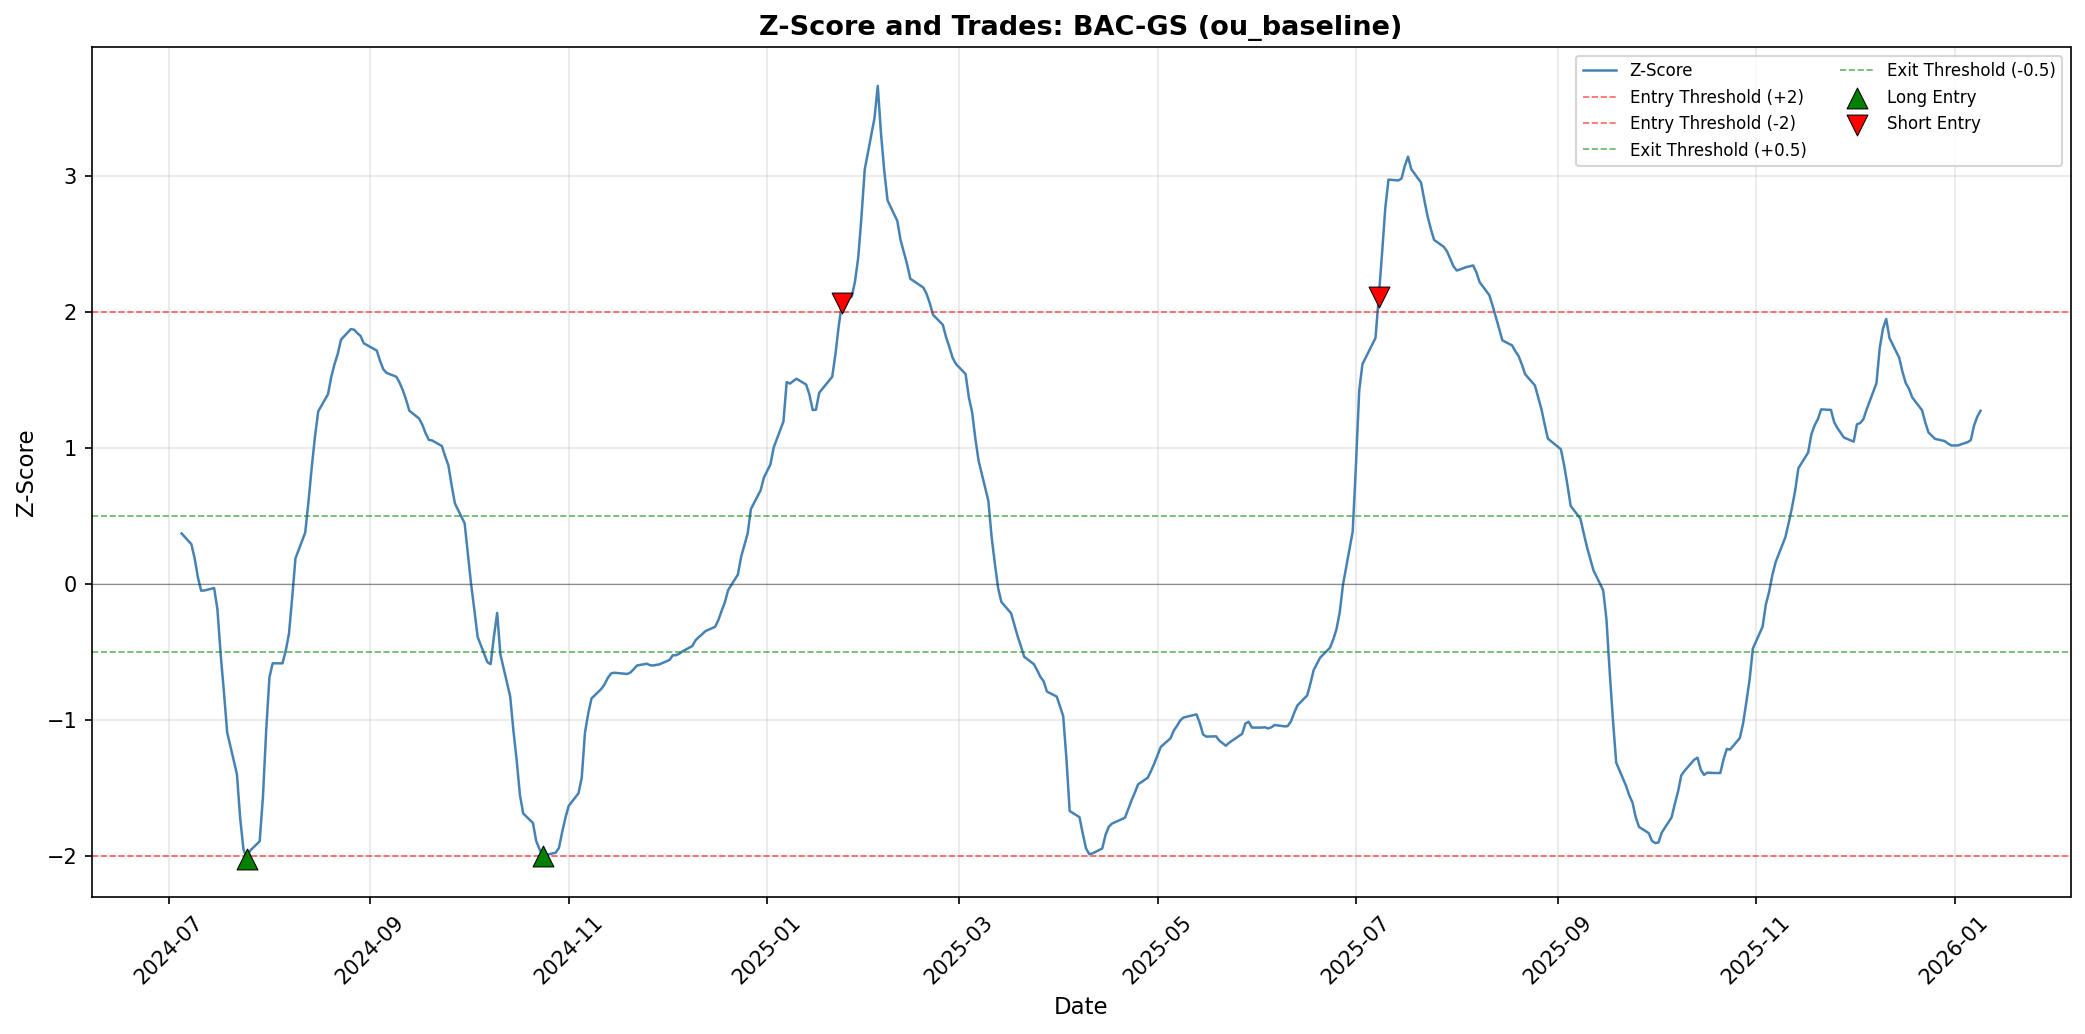
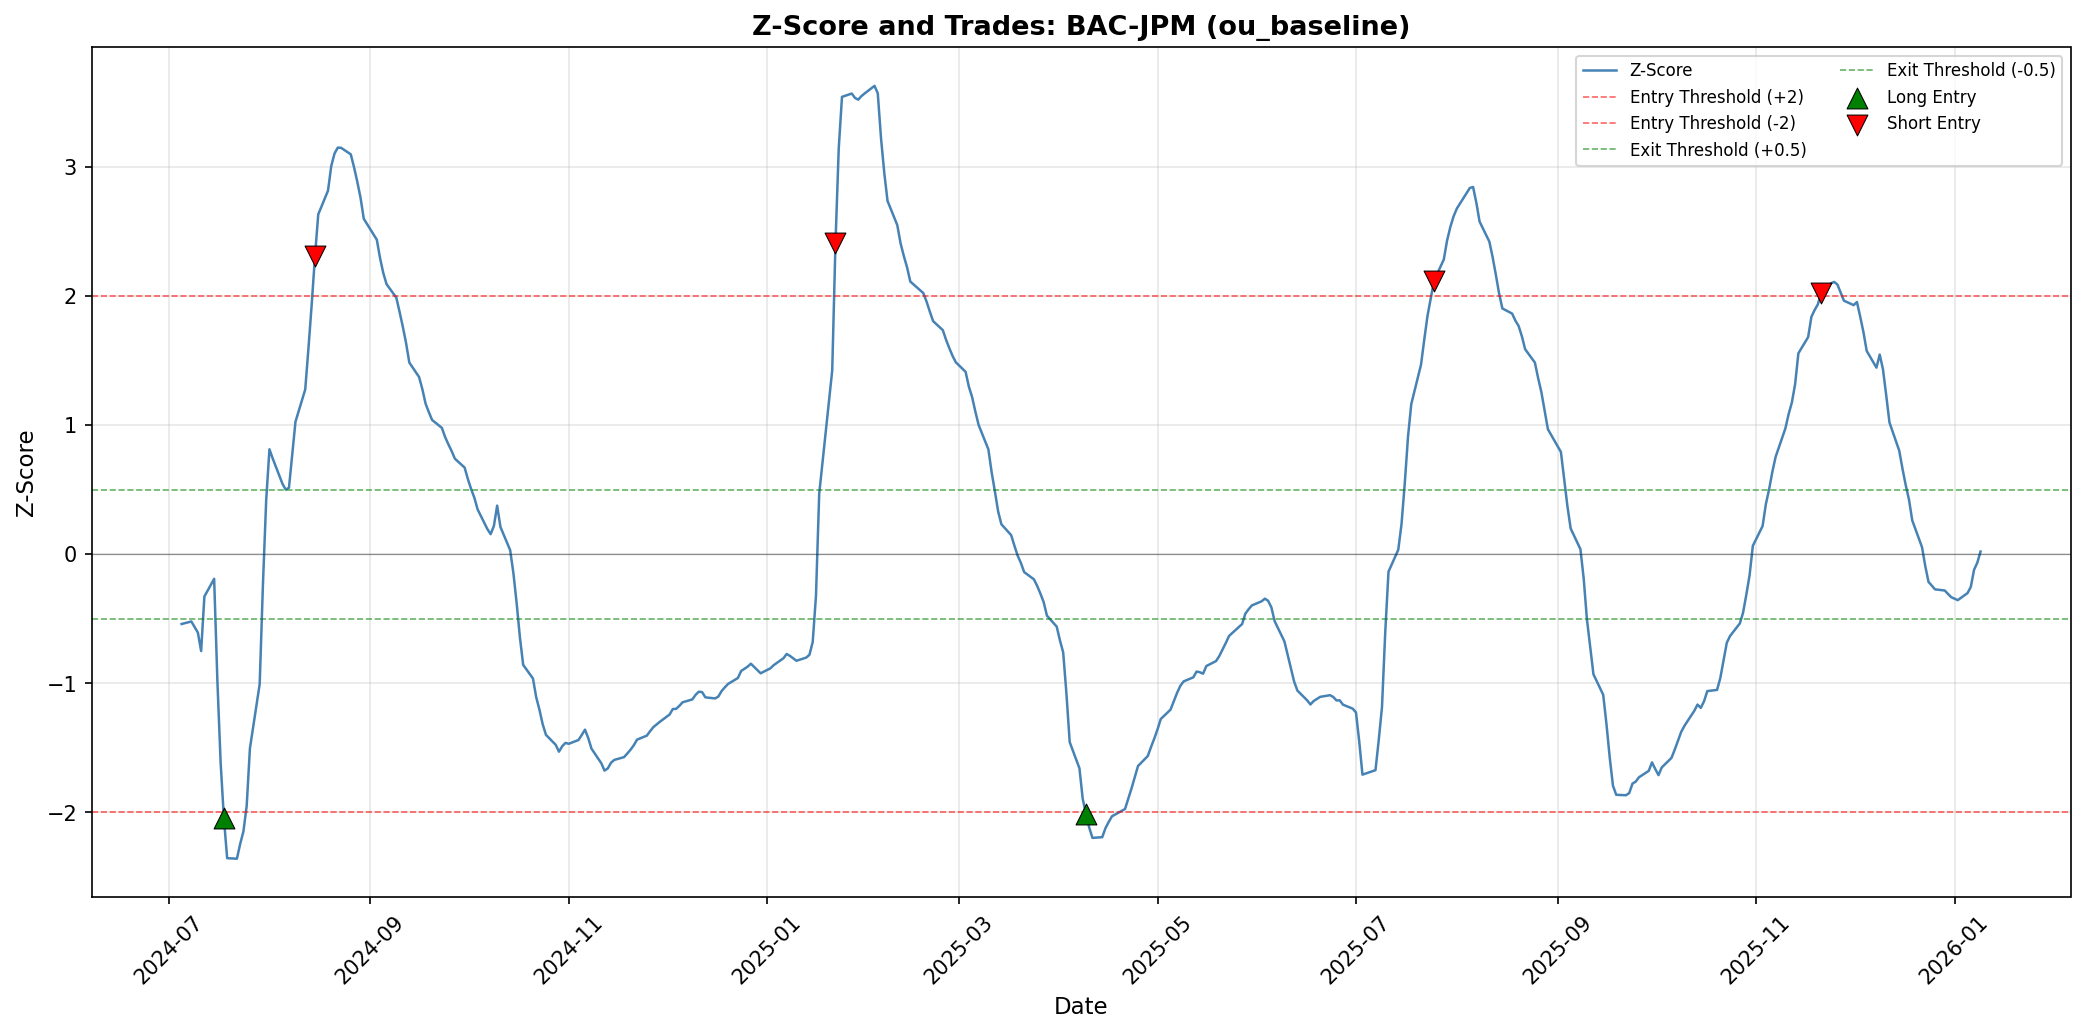
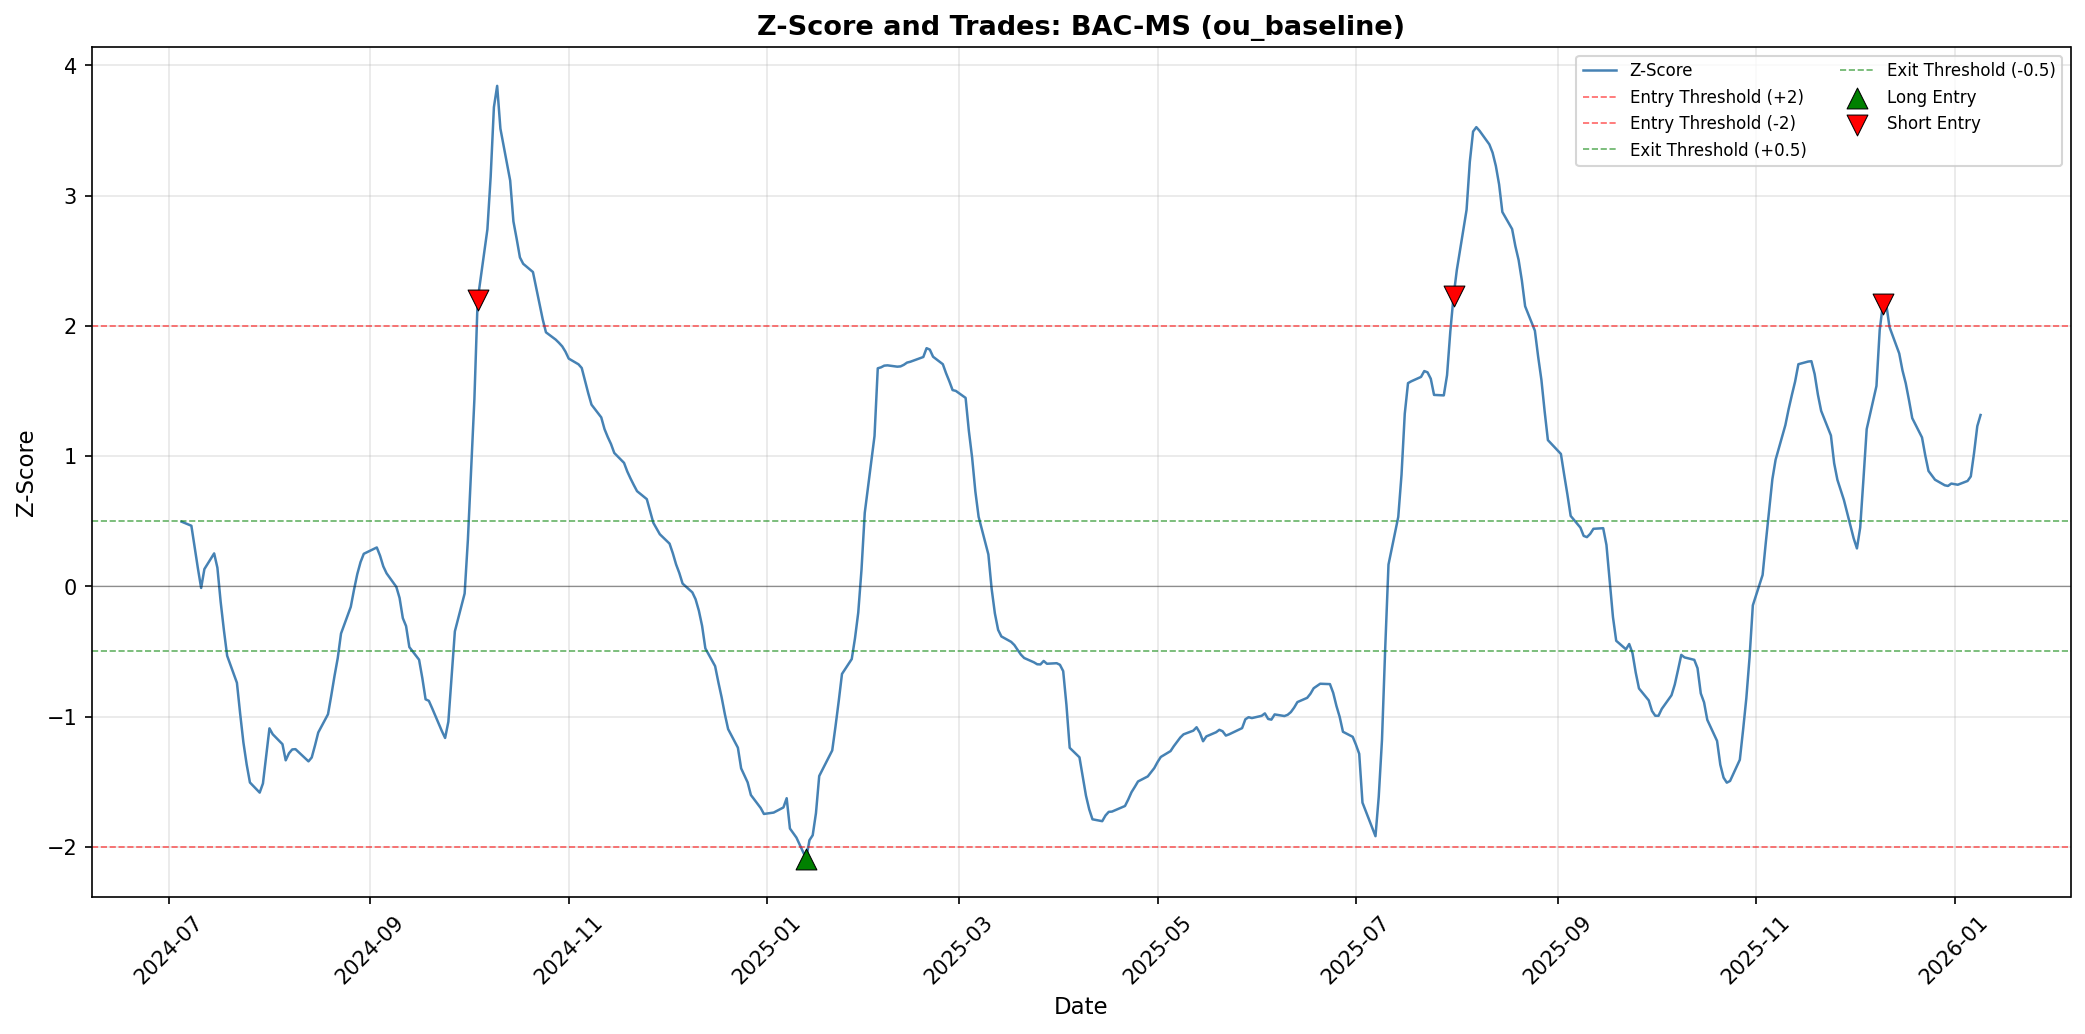
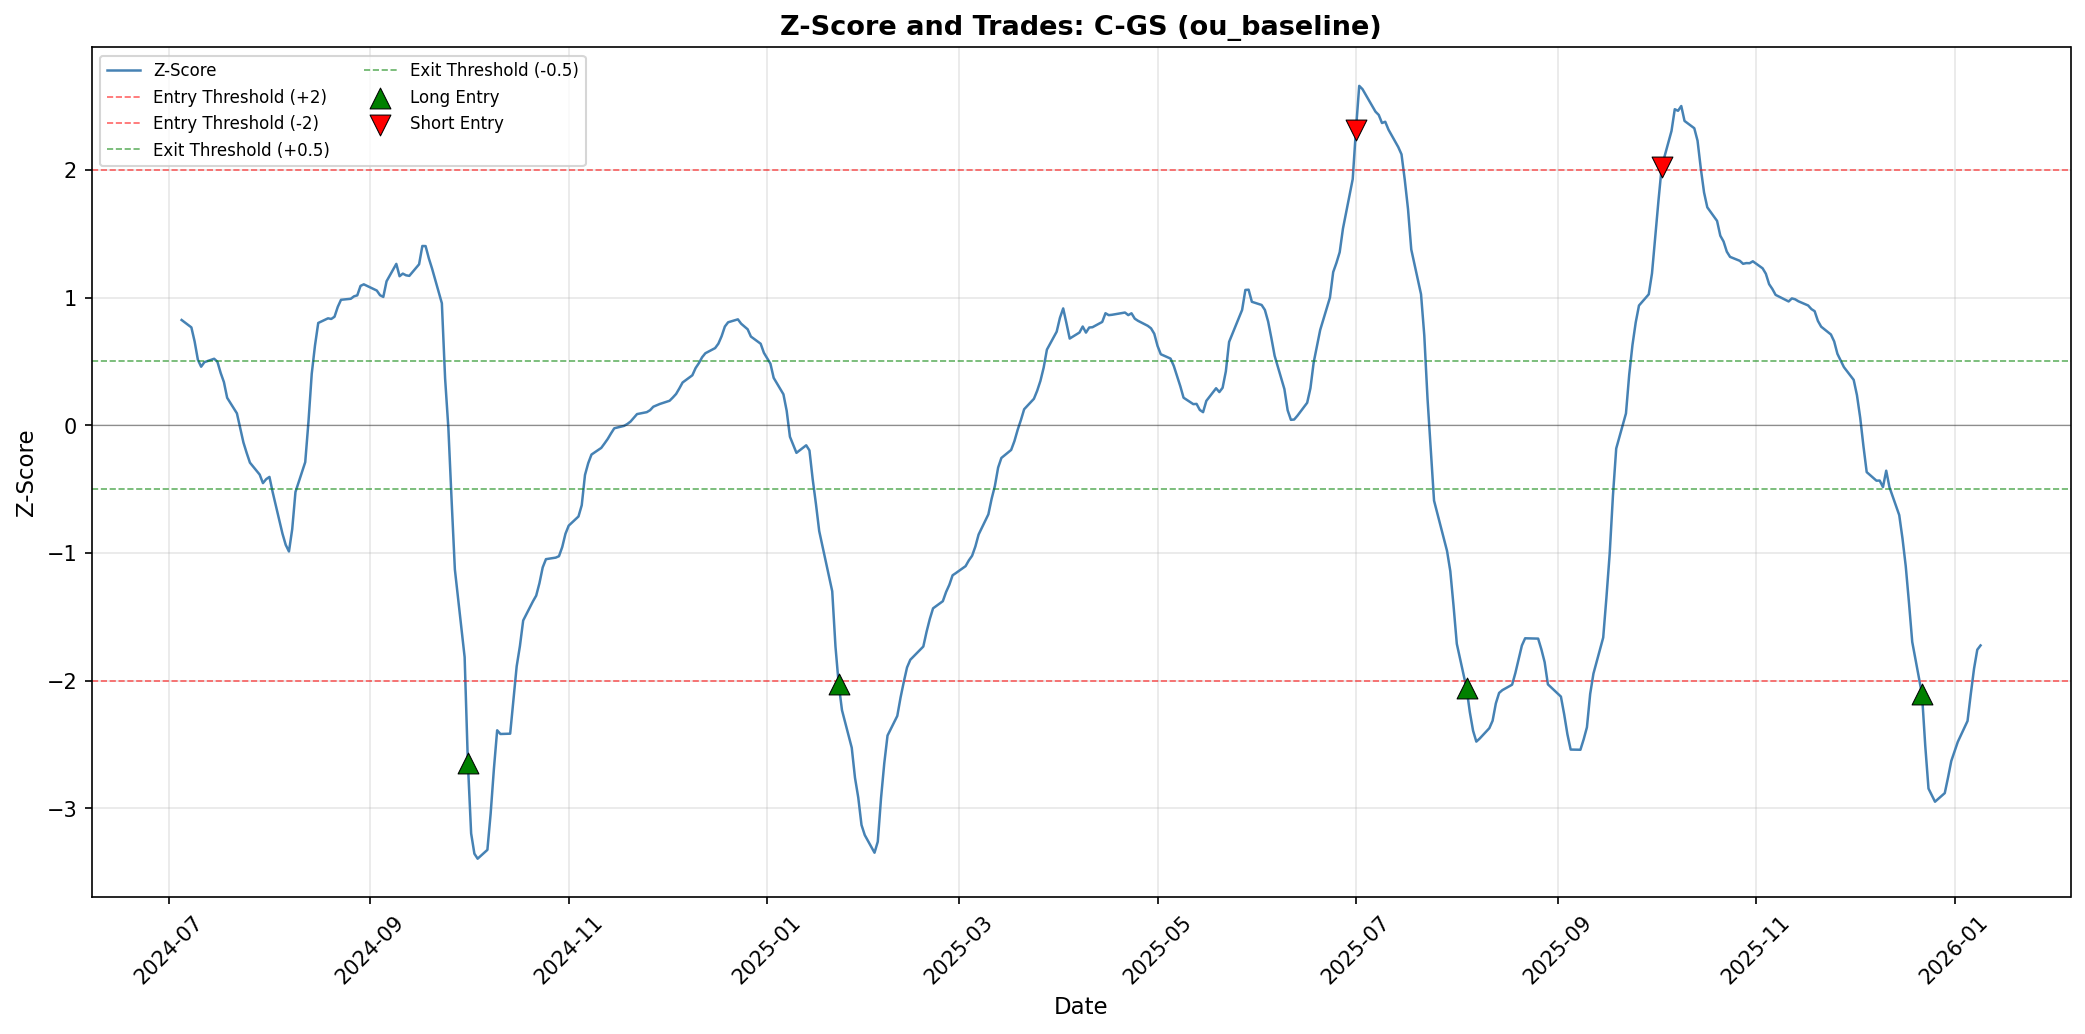
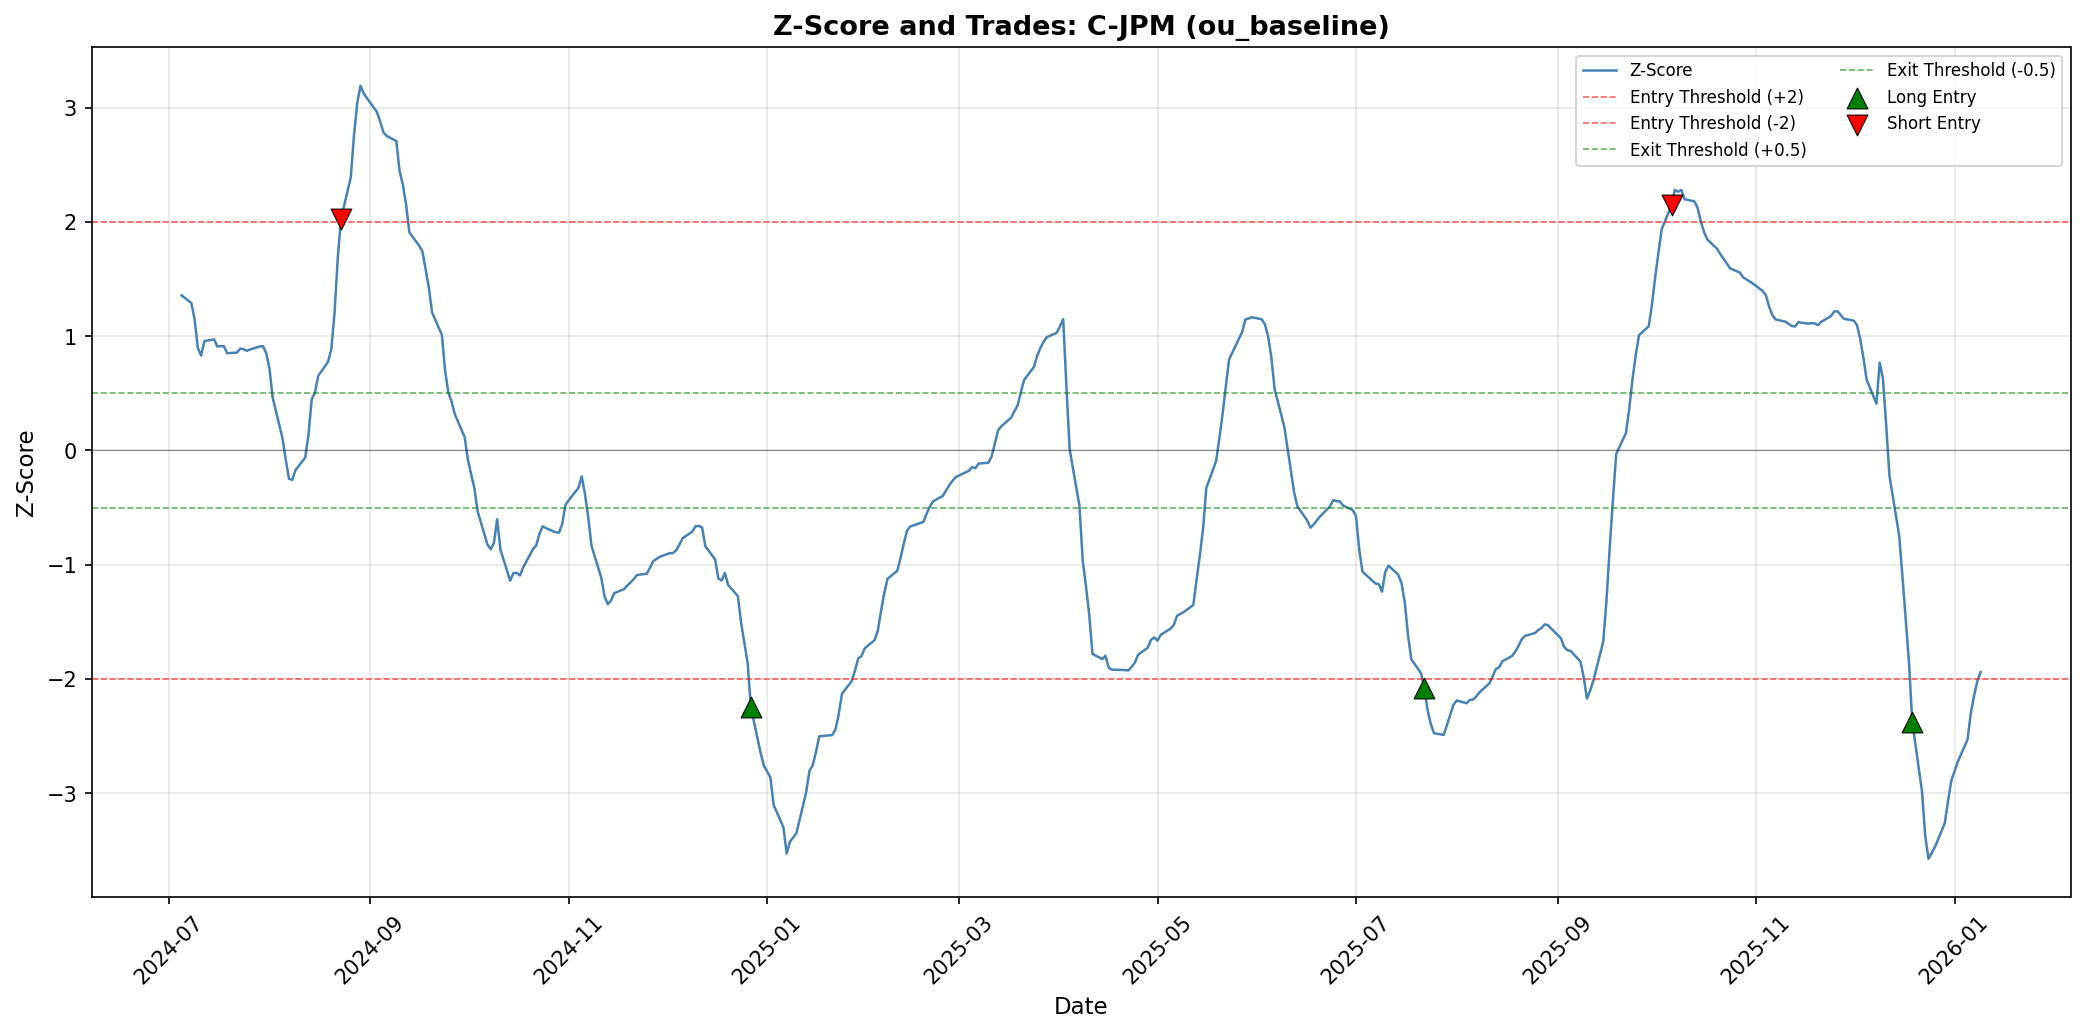
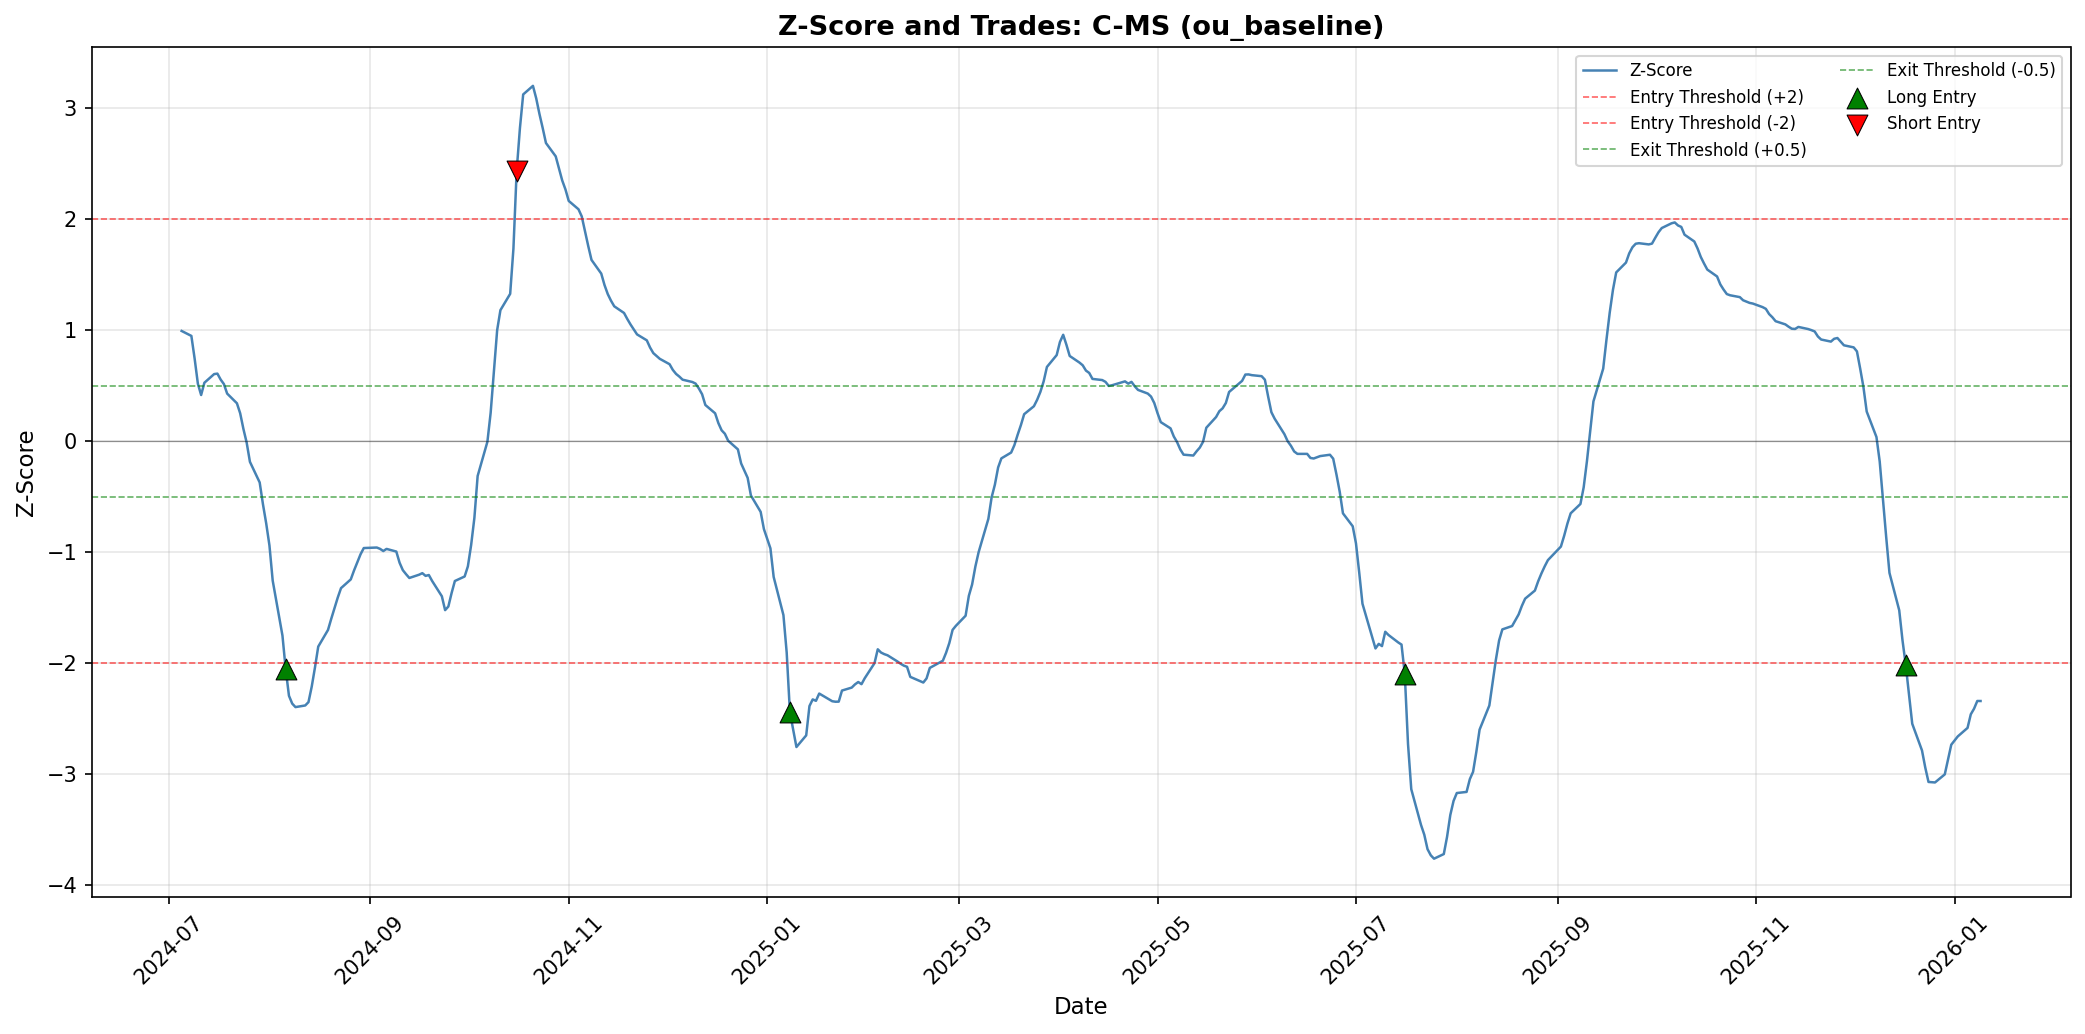
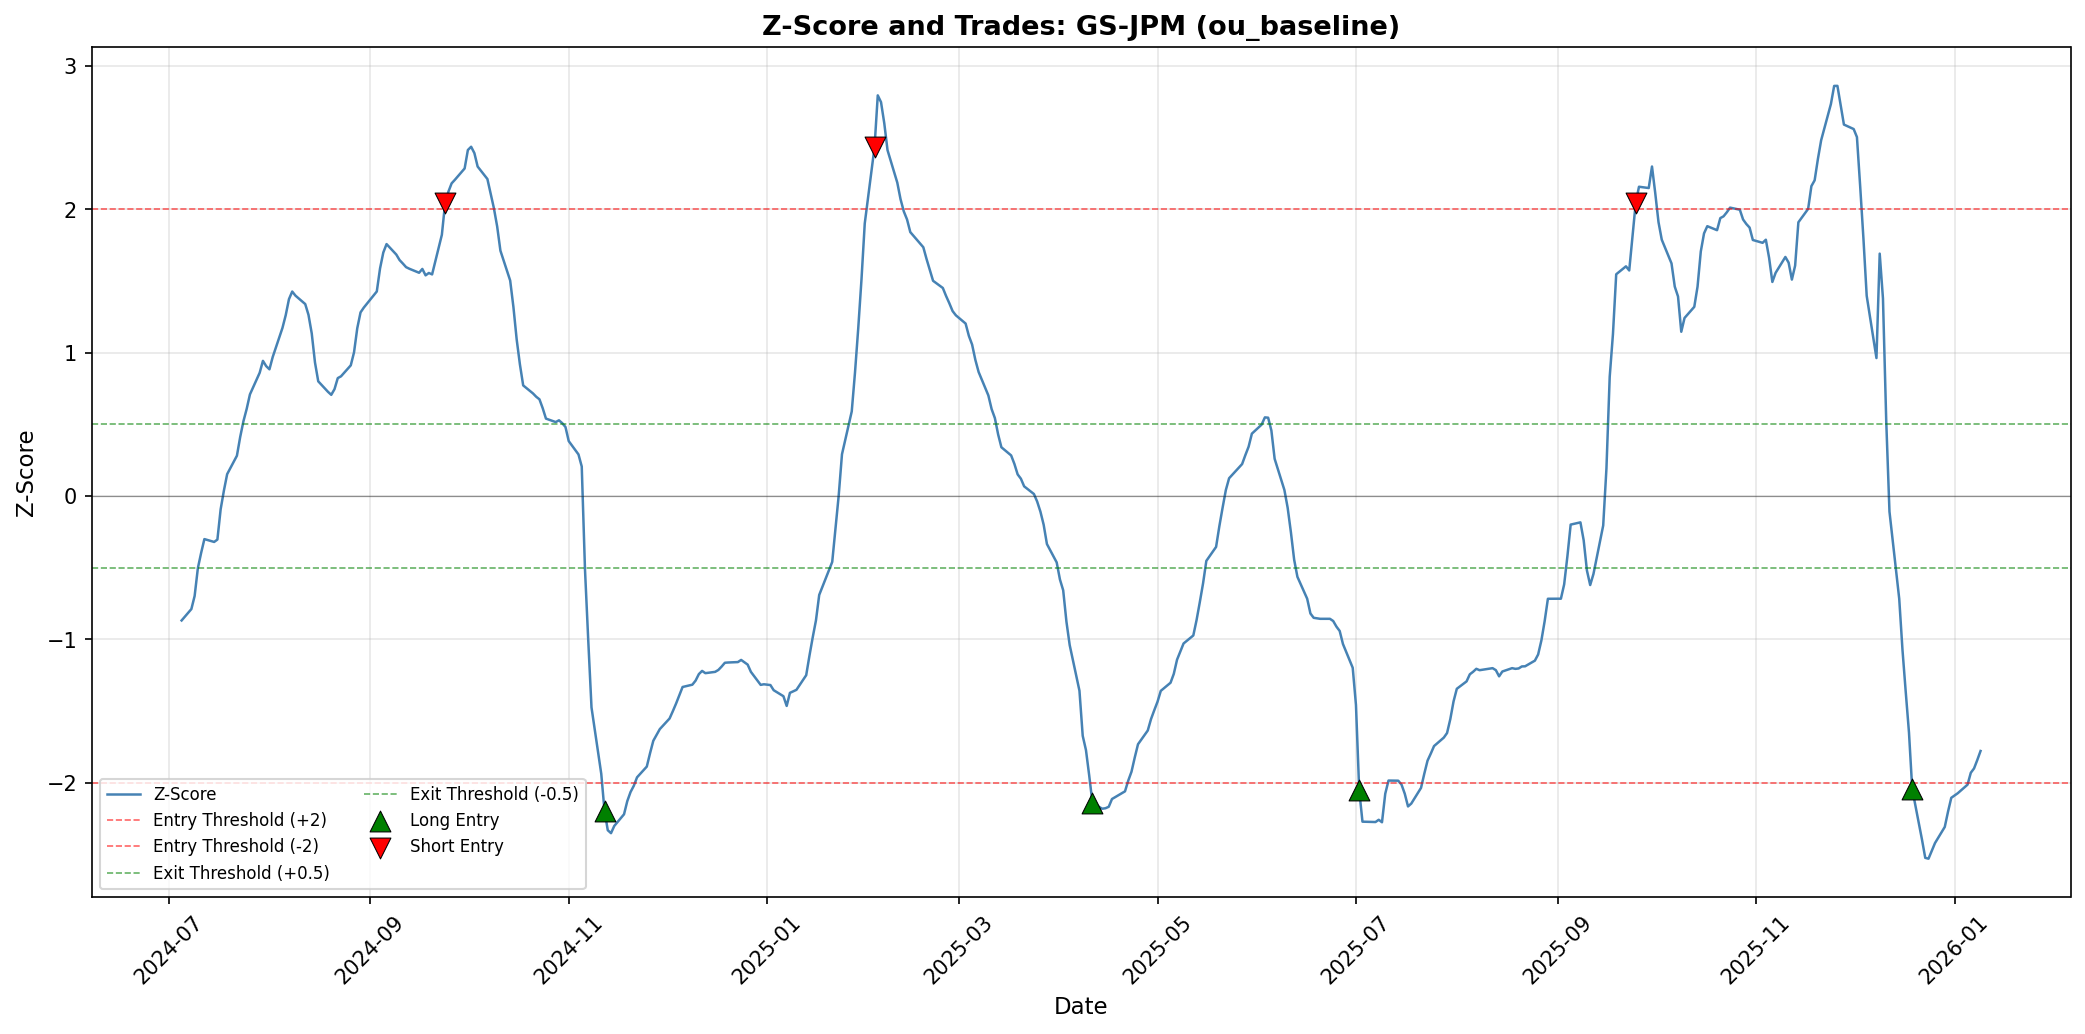
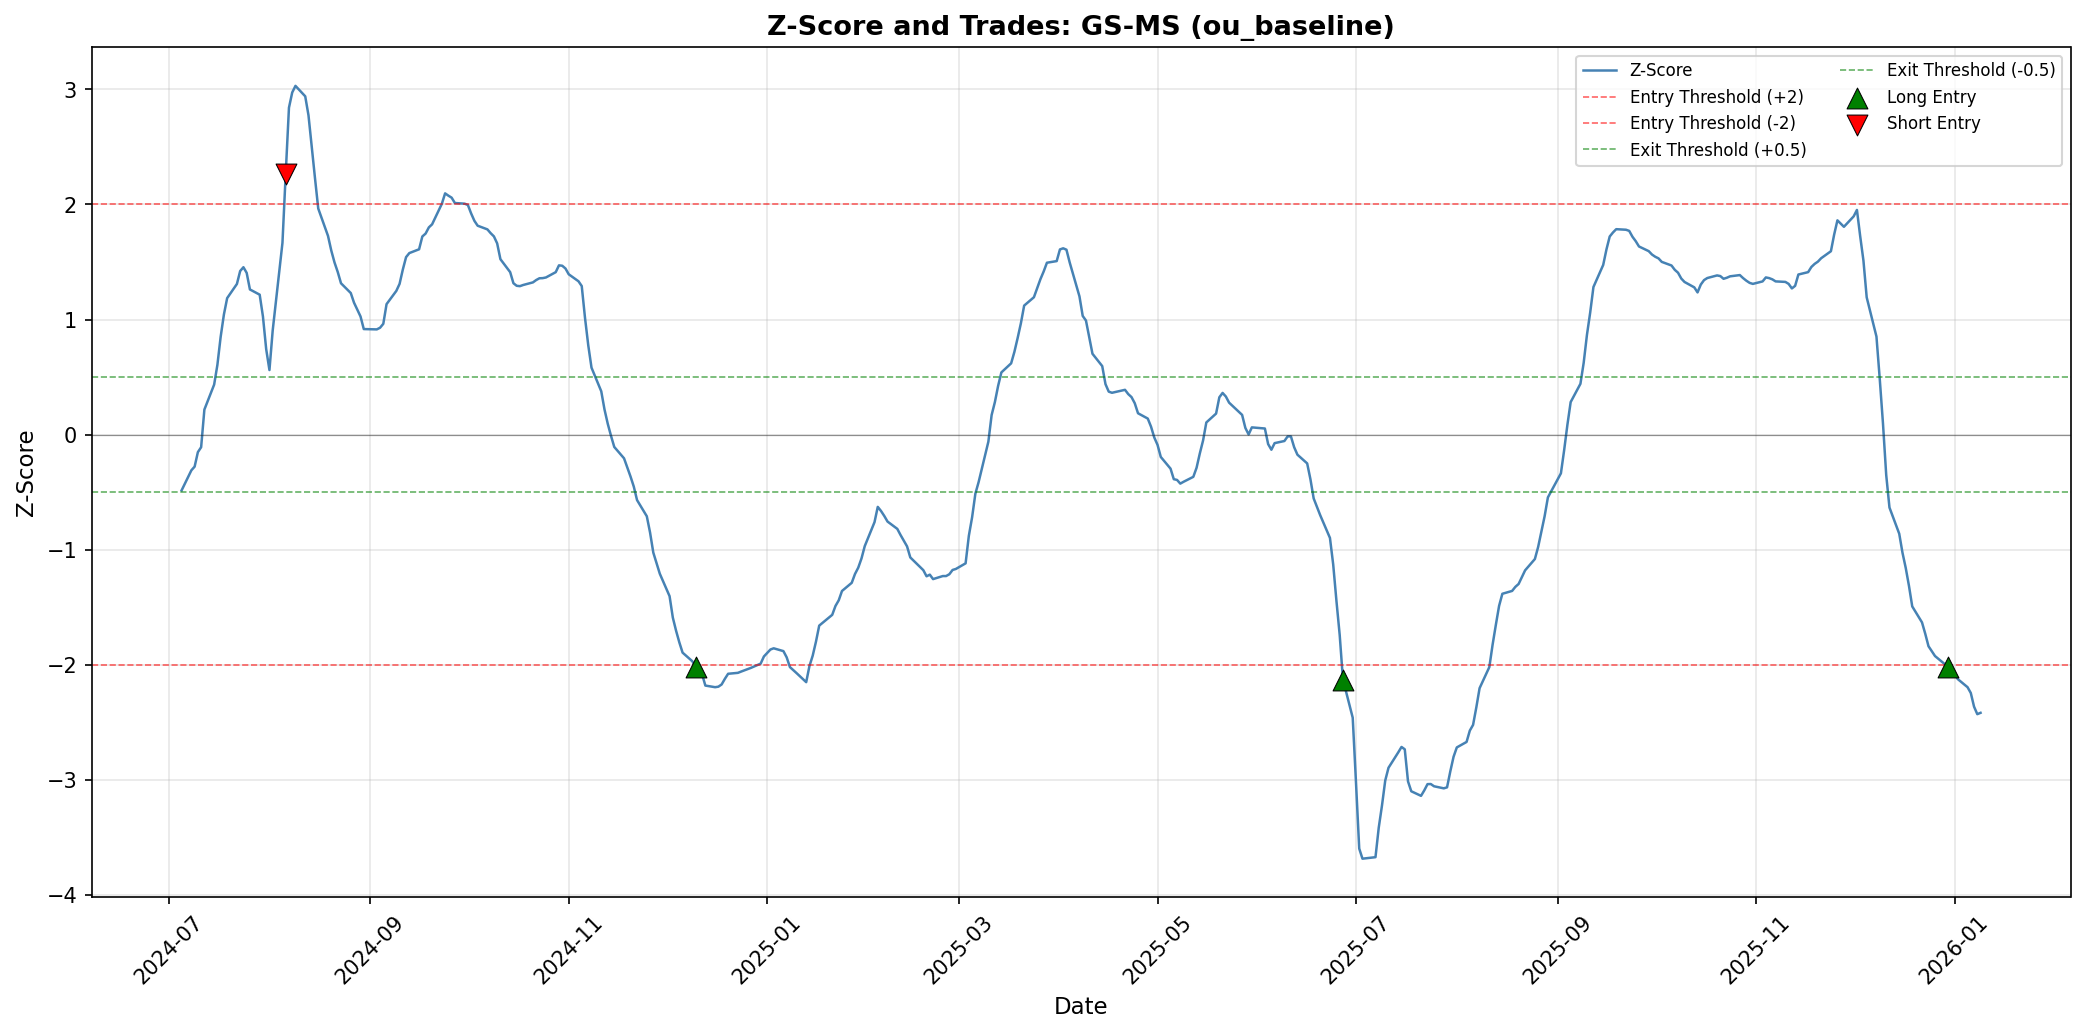
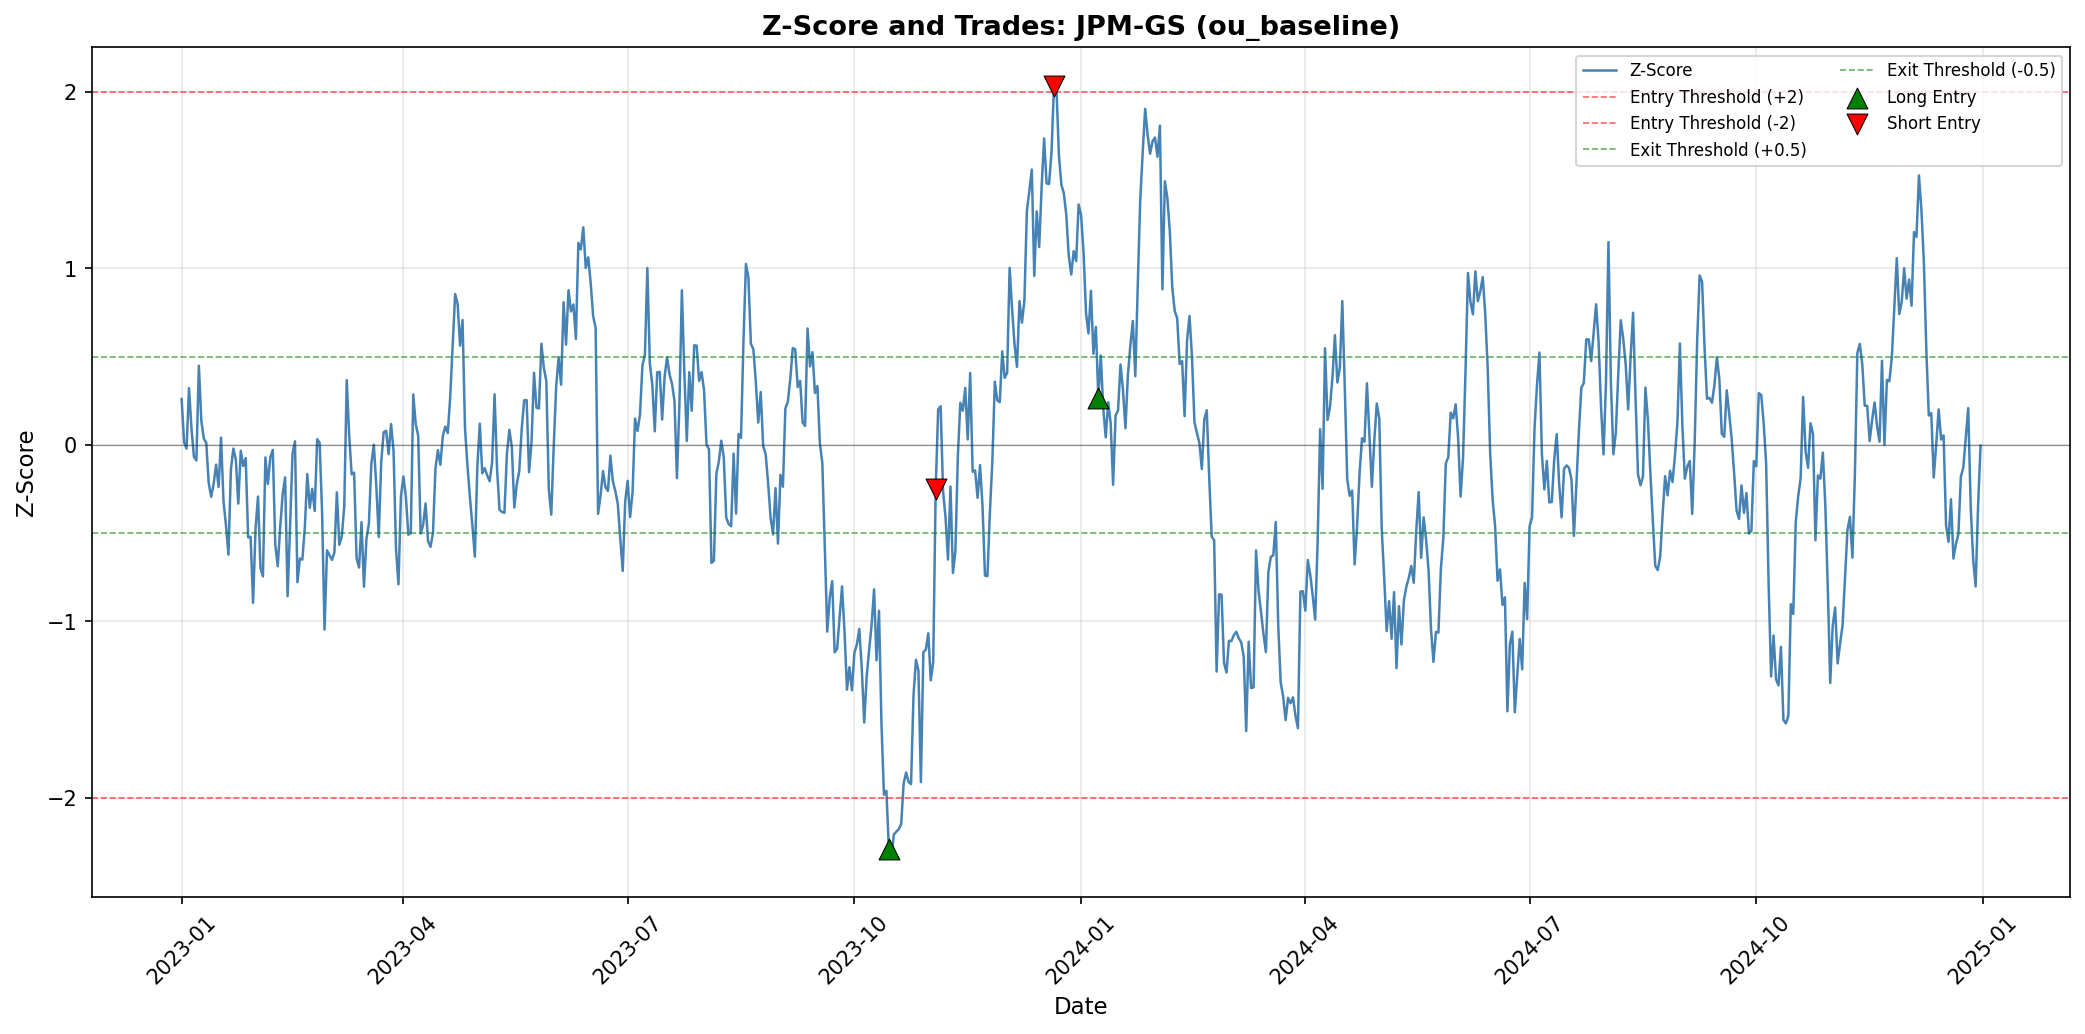
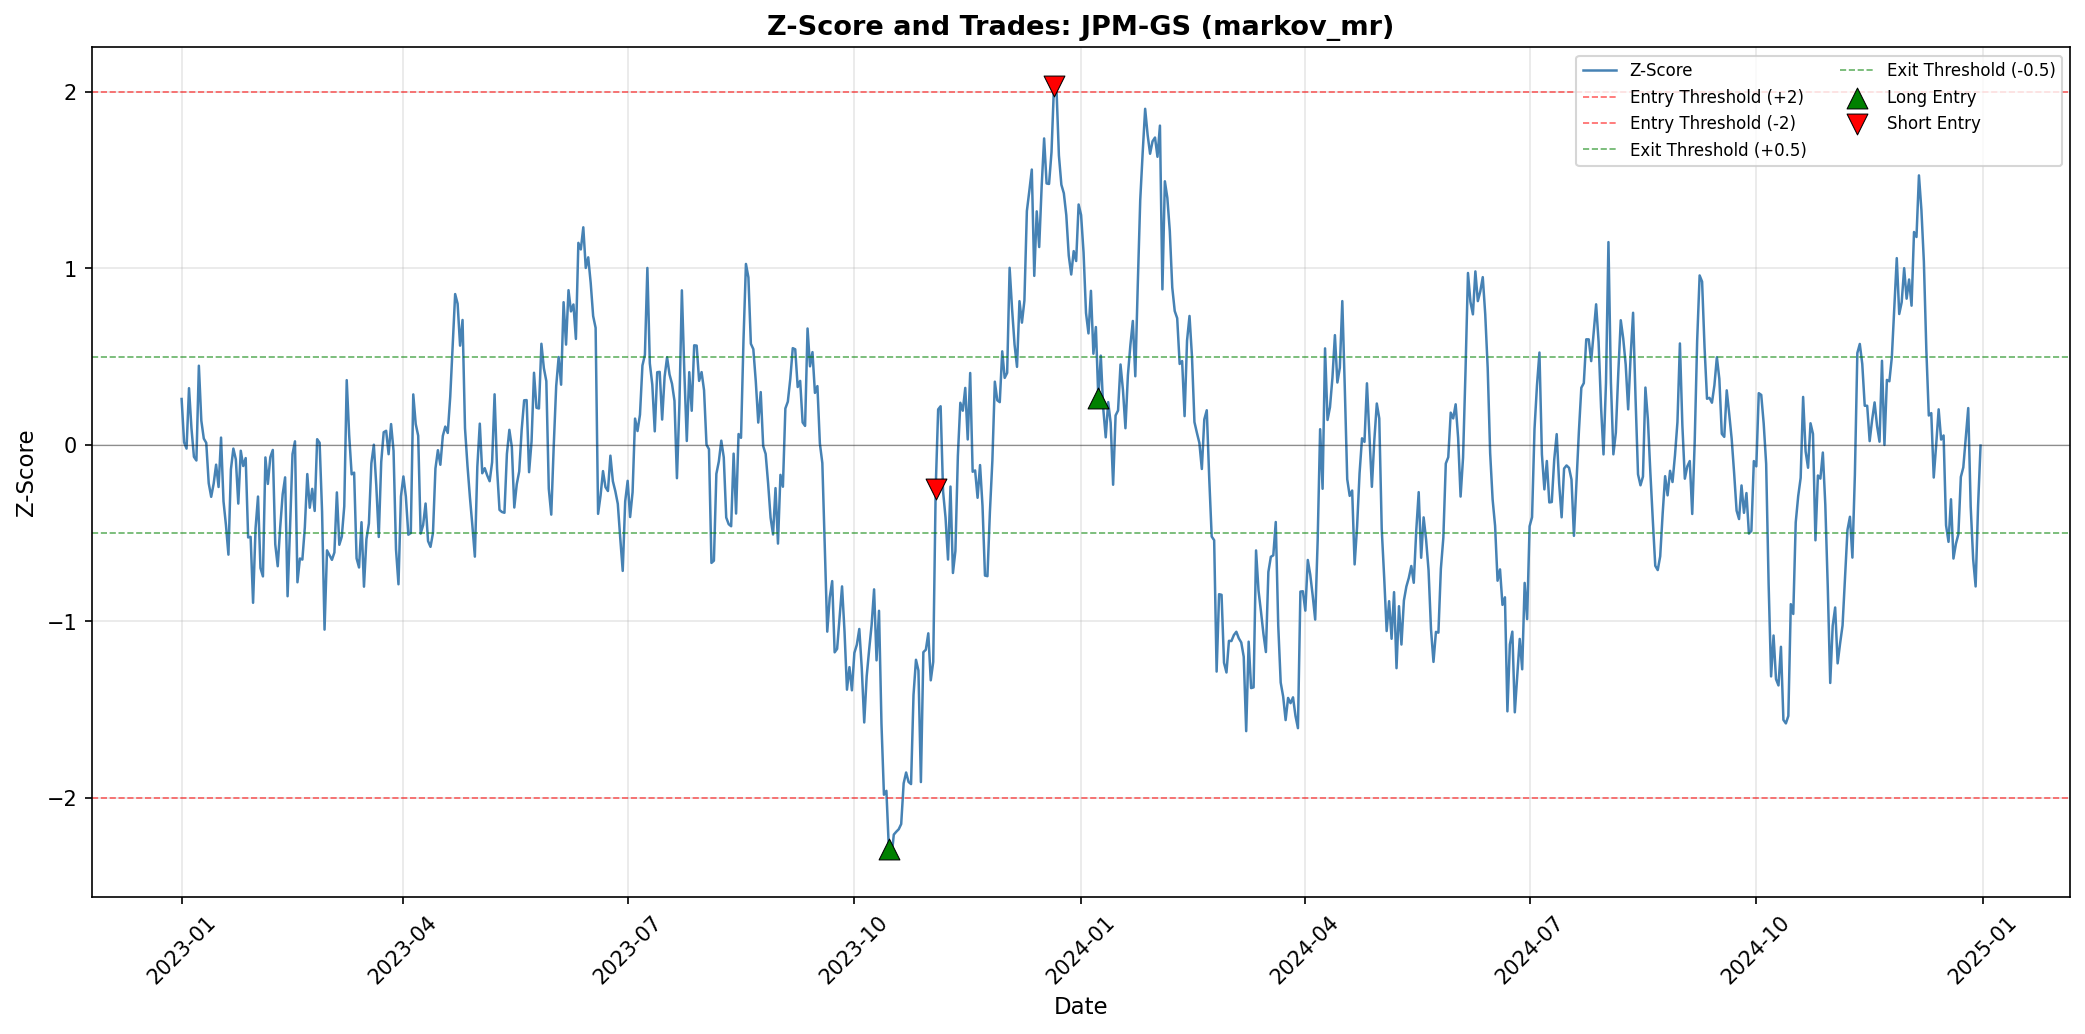
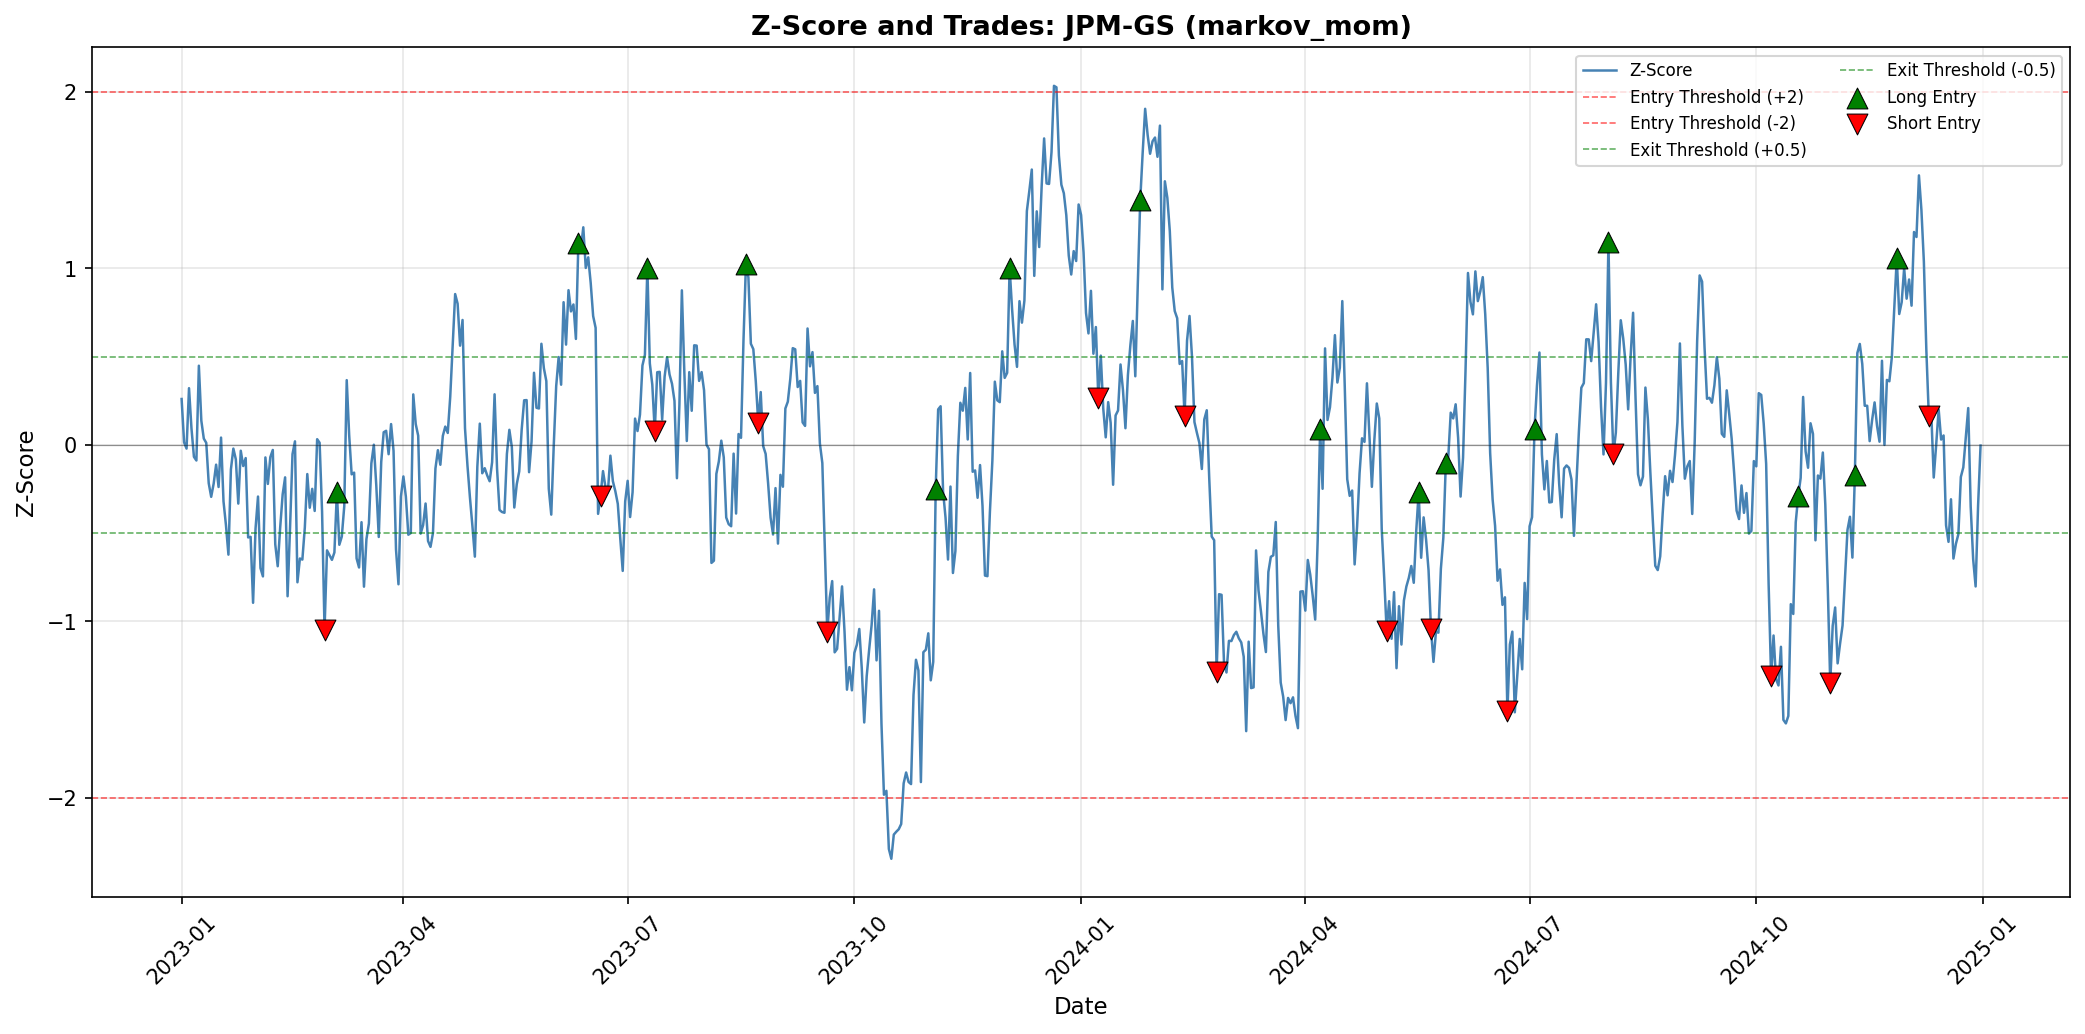
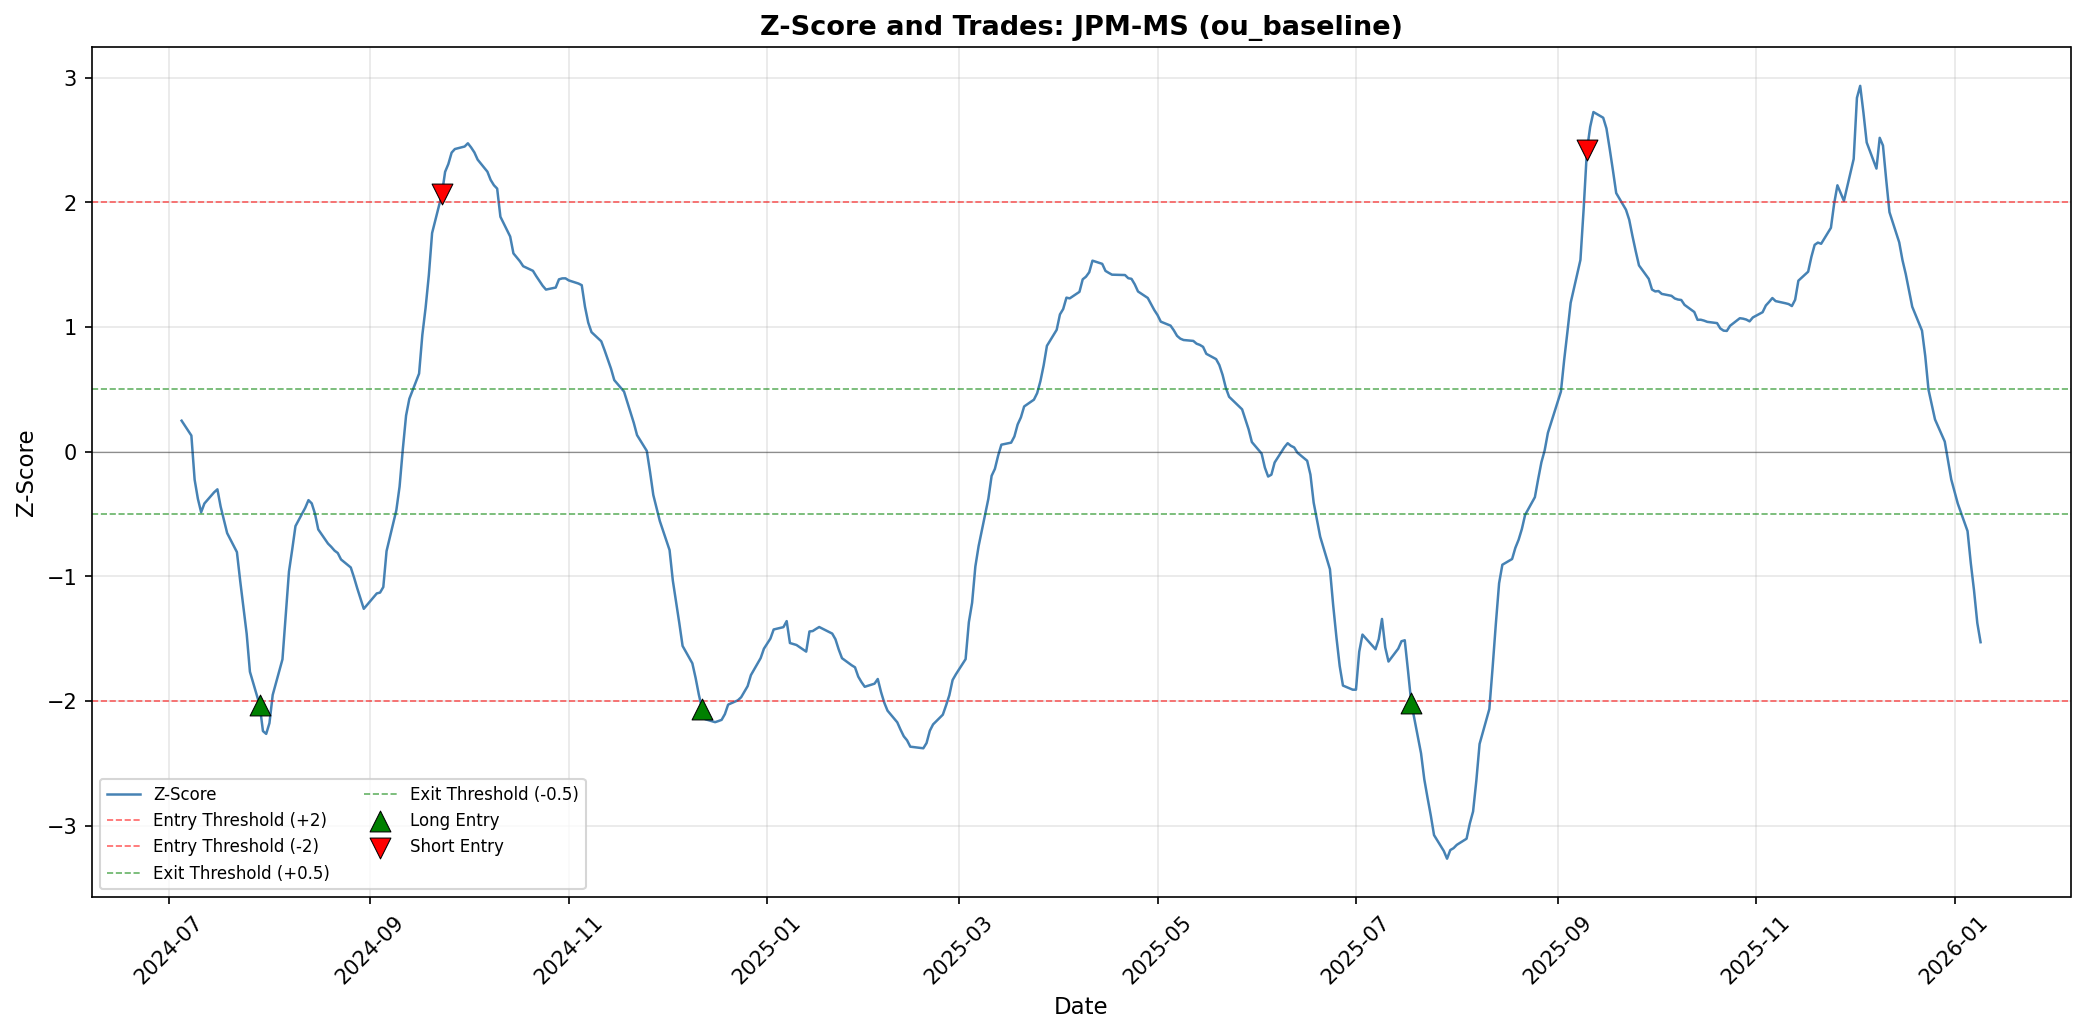
Individual Pair Z-Scores
Each plot shows the z-score time series with trade entry/exit points marked.
AAPL-MSFT Pair
GOOGL-META Pair

Financial Sector Pairs
BAC-C
BAC-GS
BAC-JPM
BAC-MS
C-GS
C-JPM
C-MS
GS-JPM
GS-MS
JPM-GS Pair (Multi-Strategy)
JPM-MS
Key Features
✅ End-to-End Pipeline - From data download to visualization in one command
✅ Research-Grade Analysis - Statistical validation of trading assumptions
✅ Realistic Backtesting - Transaction costs, no lookahead bias
✅ Comprehensive Testing - 77 unit tests covering all components
✅ Configurable - Easy parameter tuning via YAML configuration
✅ Extensible - Modular design for adding new strategies
Performance Metrics
The system computes standard quant metrics:
- CAGR (Compound Annual Growth Rate)
- Sharpe Ratio (Risk-adjusted returns)
- Maximum Drawdown (Largest peak-to-trough decline)
- Win Rate (Percentage of profitable trades)
- Turnover (Annual trade frequency)
Sample Results
2-Year Backtest (2024-2026)
- Pairs Analyzed: 10
- Trades Executed: 98
- Correlation Range: 0.79 - 0.91
- Annual Turnover: ~49 trades/year
Interactive Report
View the complete interactive HTML report for detailed analysis and additional visualizations.
Contact
Saksham Singh: Please let me know if you would like the source code for this project or if you have any suggestions. A good contact to reach me is sks17@outlook.com